| Oracle® Retail Data Model Operations Guide 10g Release 2 (10.2) Part Number E14480-02 |
|
|
PDF · Mobi · ePub |
| Oracle® Retail Data Model Operations Guide 10g Release 2 (10.2) Part Number E14480-02 |
|
|
PDF · Mobi · ePub |
This chapter introduces the analytic and reporting capabilities of Oracle Retail Data Model.
This chapter contains the following topics:
Sample reports and dashboards are delivered with Oracle Retail Data Model. They are listed in a spreadsheet that resides in the following directory.
ORACLE_HOME/ORDM/REPORT/INSTALL
Note:
The reports and dashboards that are used in examples and delivered with Oracle Retail Data Model are provided only for demonstration purposes. They are not supported by Oracle.These sample reports illustrate the analytic capabilities provided with Oracle Retail Data Model -- including the OLAP and data mining capabilities.
The sample reports were developed using Oracle Business Intelligence Suite Enterprise Edition (Oracle BI EE) using the sample repository defined by the RBIAII.rpd file. Oracle BI EE is a comprehensive suite of enterprise BI products that delivers a full range of analysis and reporting capabilities. Thus, the reports also illustrated the ease with which you can use Oracle BI EE Answers and Dashboard presentation tools to create useful reports.
The sample reports delivered with Oracle Retail Data Model include:
In a retail environment, "basket" refers to the items a customer purchases in one transaction, as with a shopping cart of groceries or a car and a number of options. The size, context, and number of baskets sold are all valuable pieces of information.
This model addresses the business problem of building a profile of associates to explain their basket Key Performance Indicators (KPIs), such as Total Baskets, Average Basket Value, and other statistics.
An Associate Basket model analysis identifies which key attributes of an associate influence his or her number of baskets sold, average basket value, and size. This model mines the various attributes of associates. It takes the binned variables one at a time for the Total Basket Count, Average Basket Value, and Average Basket Size as the target variable of an Adaptive Bayes (ABN) and Decision Tree (DT) model with a single feature and discovers rules described in terms of associate attributes.
See:
For detailed information about the Associate Basket Analysis Model delivered with Oracle Retail Data Model, see the discussion of that model in Oracle Retail Data Model Reference.For this sample report, the presentation of the Rules has been changed to better reflect the Mining Model that the rules are based on. Decision Tree (DT) Rules make sense when displayed in their entirety in the order of the hierarchy (or in the order of the parent or child nodes making up the DT model). Adaptive Bayes (ABN) Rules are independent of each other and do not have a natural display order and can be customized to suit the presentation layer (front-end report) needs.
New report layouts (OBIEE or Oracle Answers reports) displaying the Associate Profile Rules or Model Signature corresponding to the 3 target variables.
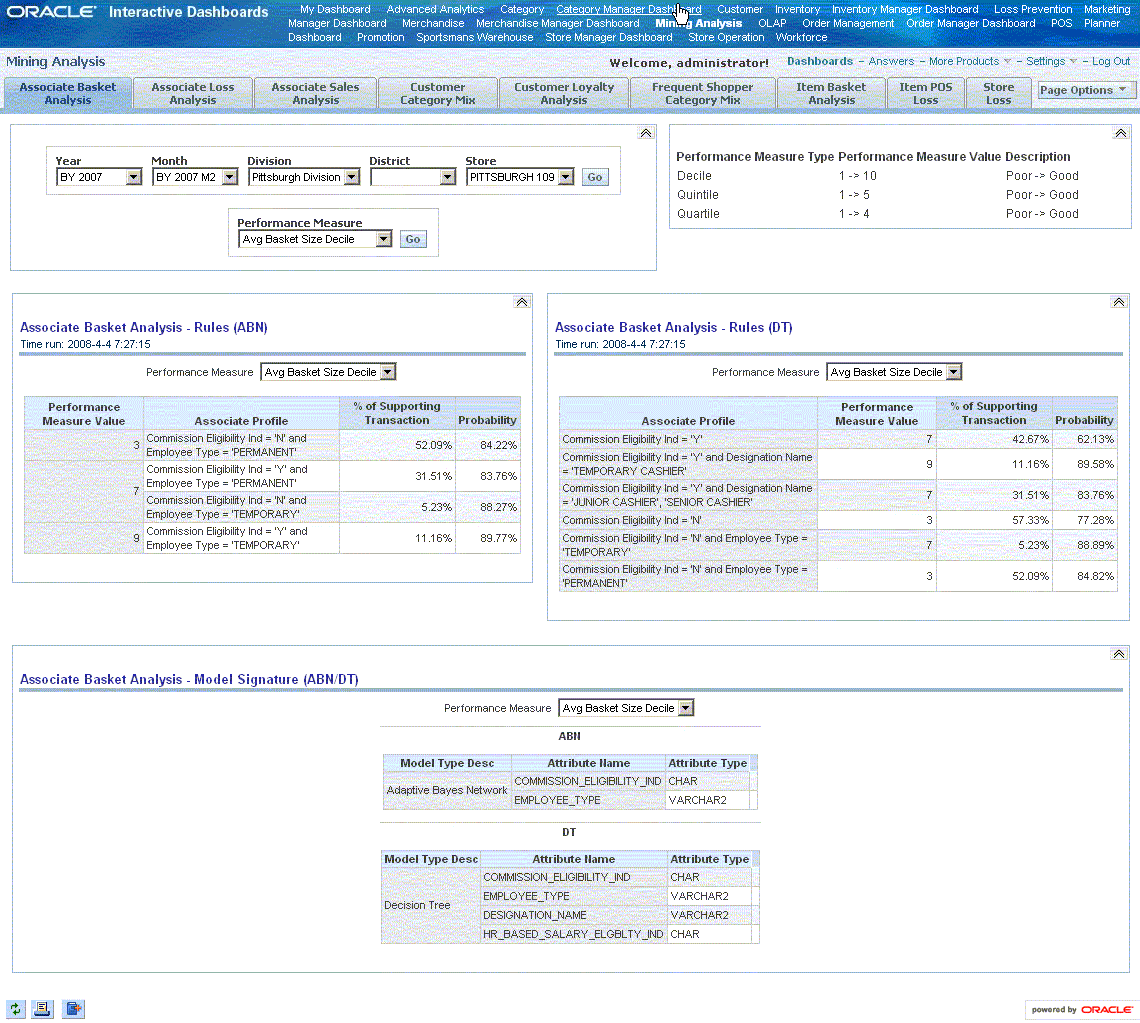
The Associate Loss Analysis model addresses the business problem of correlating associate characteristics to shrink and theft. (In a retail environment, shrink refers to merchandise that, for unknown reasons, is unaccounted for.)
The KPIs are converted into categorical variables using standard database binning operations. The categorical variables are modeled as a classification model in order to identify or predict the impact of various independent variables (attributes) on the dependent target variable (KPI - categorical).
The Associate Loss Analysis model mines the Total Shrink Count, Total Shrink Amount, Shrink as a percentage of Sales, Total Theft Count, Total Theft Amount and Theft as a percentage of Sales of individual associates to identify which of their key attributes influence their shrinkage and theft. This model takes the binned variables one at a time for Total Shrinkage and Theft Count or Value or percentage of Sales as the target variable of an Adaptive Bayes (ABN) and Decision Tree (DT) model and discovers rules described in terms of associate attributes.
See:
For detailed information about the Associate Loss Analysis Model delivered with Oracle Retail Data Model, see the discussion of that model in Oracle Retail Data Model Reference.For this sample report, the presentation of the Rules has been changed to better reflect the Mining Model that the rules are based on. Decision Tree (DT) Rules make sense when displayed in their entirety in the order of the hierarchy (or in the order of the parent or child nodes making up the DT model). Adaptive Bayes (ABN) Rules are independent of each other and do not have a natural display order and can be customized to suit the presentation layer (front-end report) needs.
New report layouts (OBIEE or Oracle Answers reports) displaying the Associate Profile Rules or Model Signature corresponding to the 3 target variables.
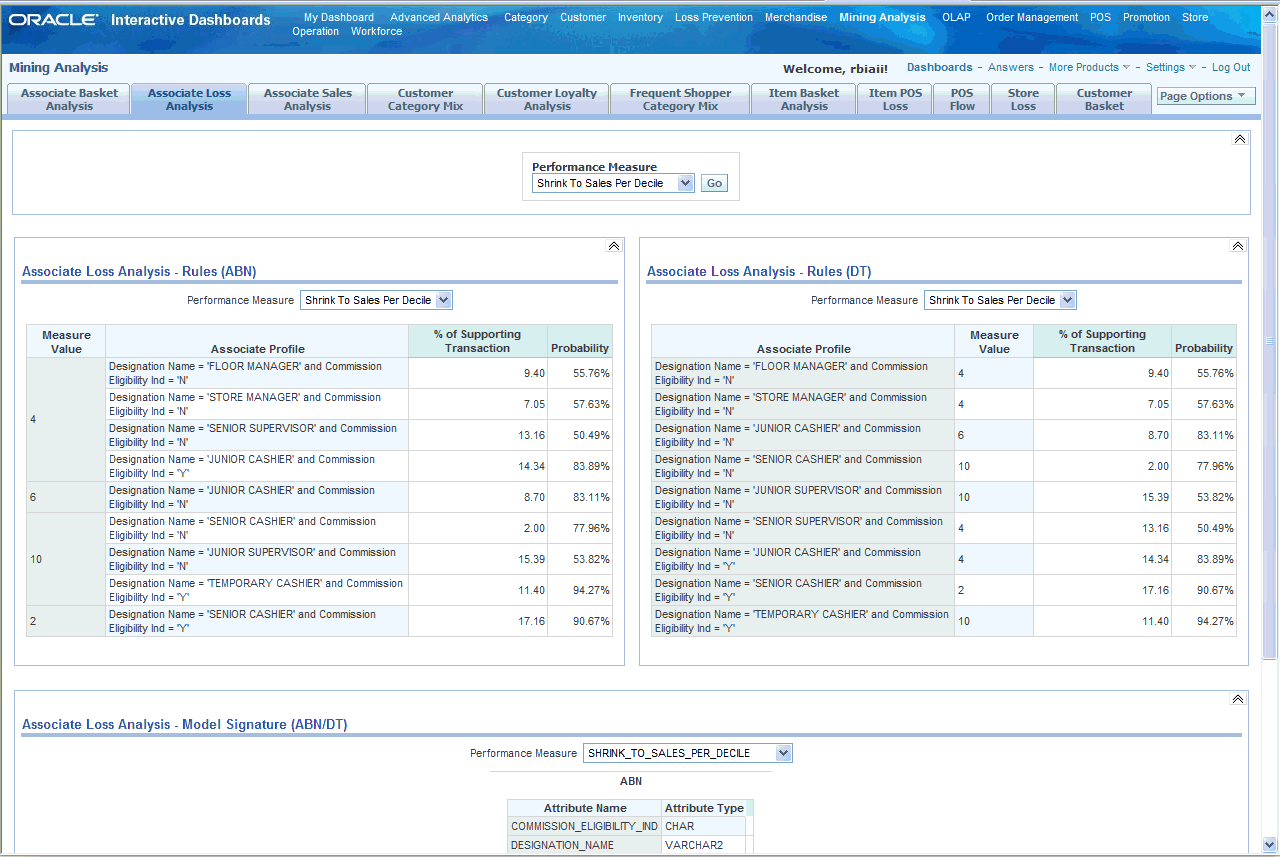
This sample OBIEE report shows Associate Shrink to Sales Rules:
Figure 4-1 Shrink to Sales Data Mining Report
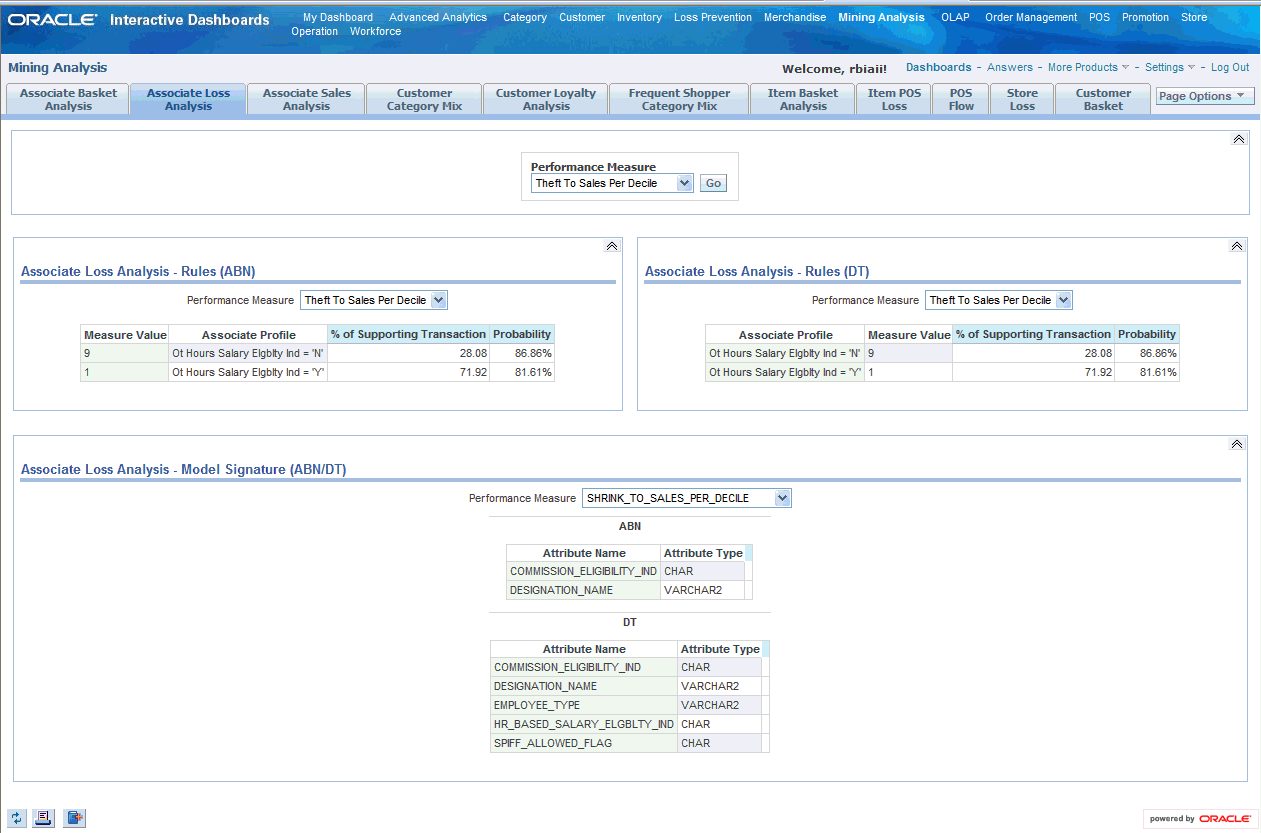
This sample OBIEE report shows Associate Theft to Sales Rules:
Figure 4-2 Theft to Sales Data Mining Report
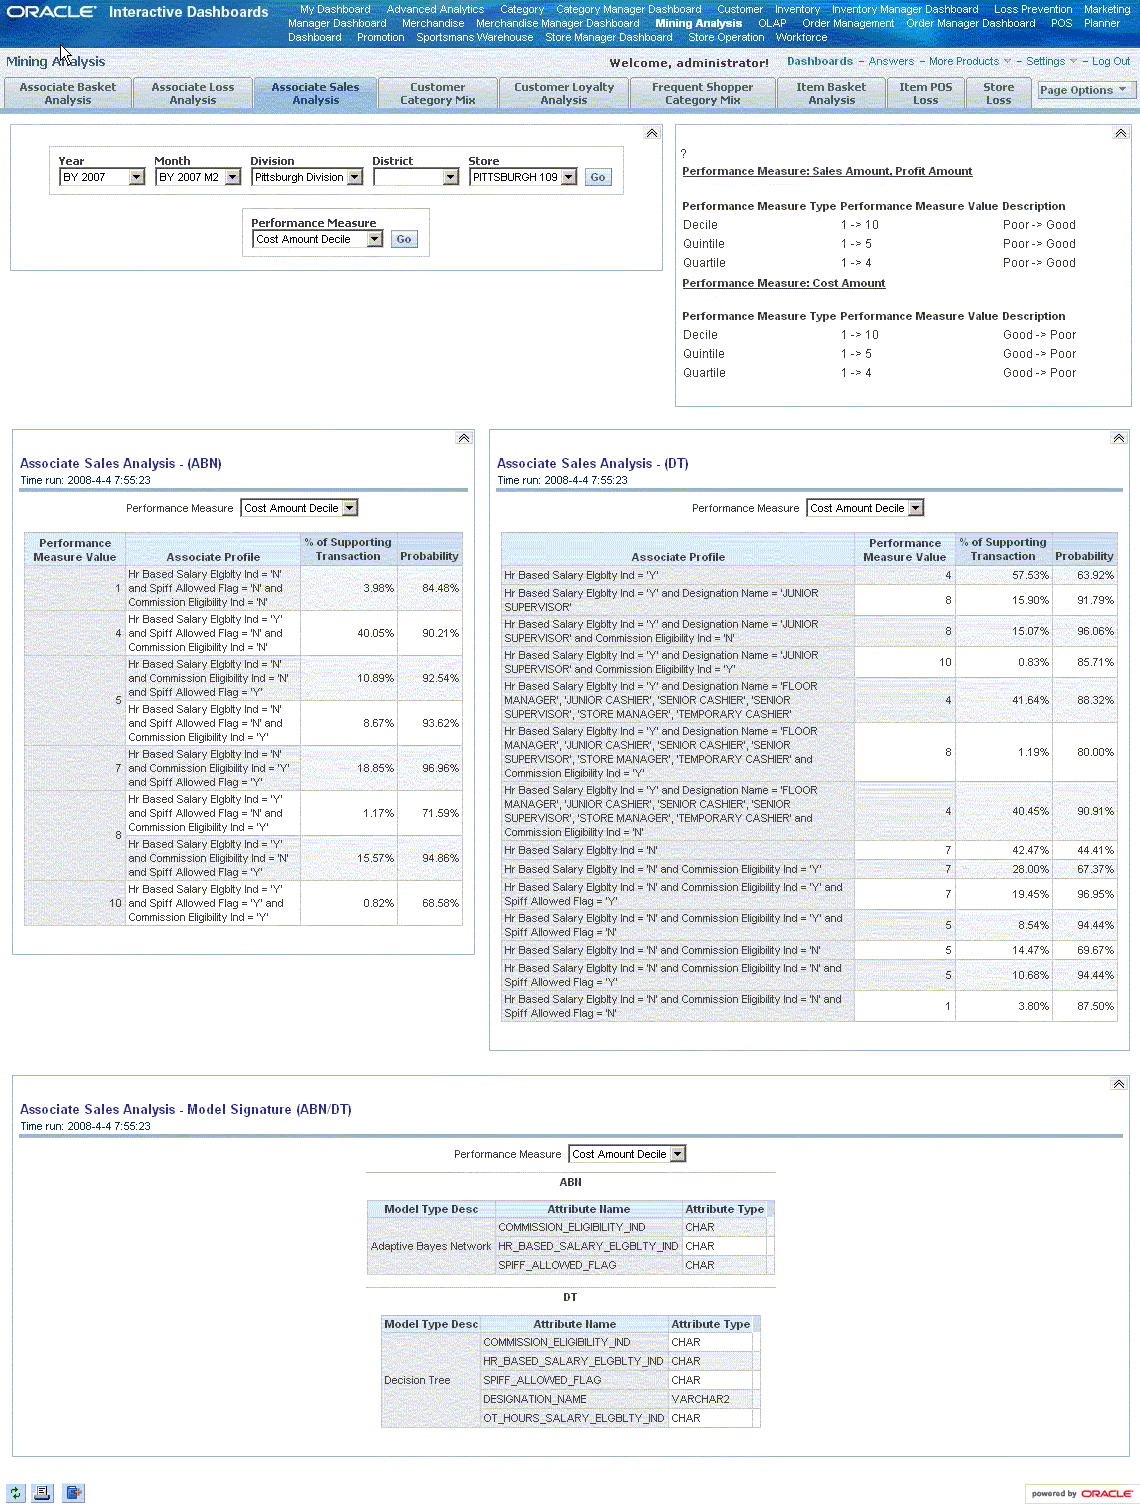
The Associate Sales Analysis model addresses the business problem of profiling associate characteristics to sales, cost, and profit patterns.
The KPIs are converted into categorical variables using standard database binning operations. The categorical variables are modeled as a classification model in order to identify or predict the impact of various independent variables (attributes) on the dependent target variable (KPI - categorical).
This model mines the various attributes of associates. It takes the binned variables one at a time for Sales, Costs, and Profits as the target variable of an Adaptive Bayes (ABN) and Decision Tree (DT) model with a single feature and discovers rules described in terms of associate attributes.
See:
For detailed information about the Sample Sales Analysis Model delivered with Oracle Retail Data Model, see the discussion of that model in Oracle Retail Data Model Reference.For this sample report, the presentation of the Rules has been changed to better reflect the Mining Model that the rules are based on. Decision Tree (DT) Rules make sense when displayed in their entirety in the order of the hierarchy (or in the order of the parent or child nodes making up the DT model). Adaptive Bayes (ABN) Rules are independent of each other and do not have a natural display order and can be customized to suit the presentation layer (front-end report) needs.
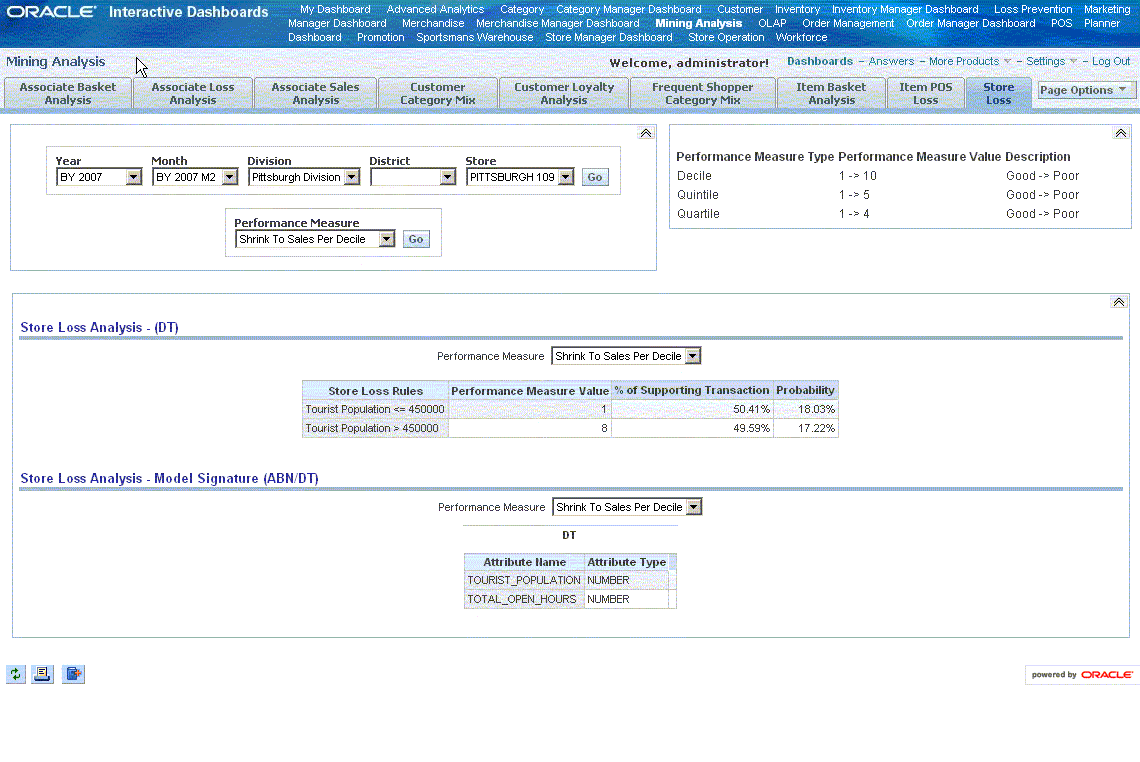
The following report shows the layout of the Store Loss report.
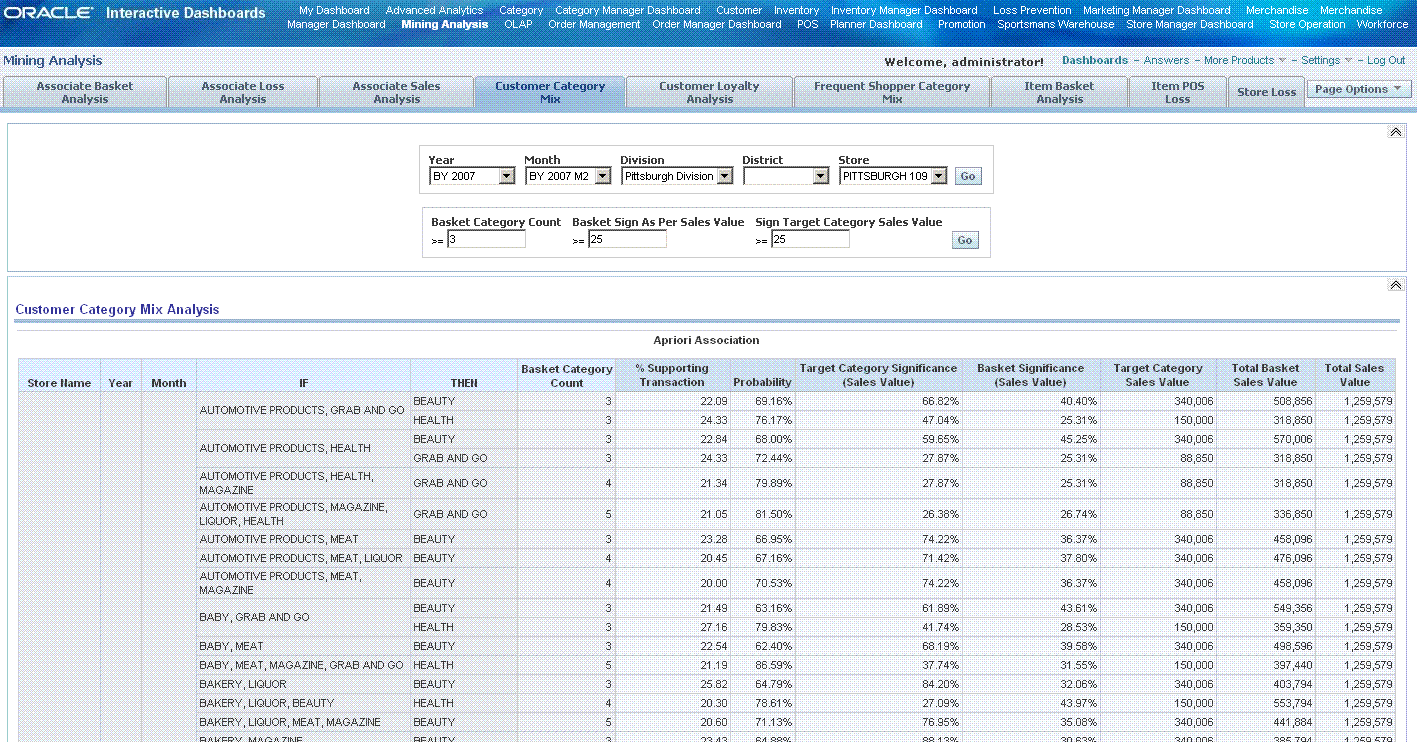
The Customer Category Mix Analysis model addresses the business problem of discovering product categories that are frequently bought together by customers. The model is used to understand the Categories purchased by a Customer in a typical transaction in terms of the components like the Categories in the Basket, Target Category in a Basket and additional information like Basket Significance (Sales Value), Target Category Significance (Sales Value) which are generated from regular Customer Transactional data.
Using Oracle Data Mining, the KPIs are modeled with the APRIORI algorithm utilized by the Association Rules model. The model type used for Association Rules with Apriori Algorithm is APASS. This is an example of Unclassified Learning since the Categories (or Target Category) which make up the Category Basket are not inferred or guided (as part of data preparation) but are generated by the model itself.
This model mines the monthly purchases of individual customers and discovers rules about the categories that are frequently bought in groups by customers.
See:
For detailed information about the Customer Category Mix Analysis Model delivered with Oracle Retail Data Model, see the discussion of that model in Oracle Retail Data Model Reference.For this sample report, the presentation of the Rules for Category Mix Analysis has been enhanced by the introduction of an additional Dashboard prompt to filter the Report (Rules) on (a) Number of Categories in the Rule, (b) Category Basket Significance (Sales Value) and (c) Target Category Significance (Sales Value) within the Category Basket.
The following is a portion of the Customer Product Category Mix Analysis report.
The Customer Loyalty Analysis model addresses the business problem of discovering the impact of customer characteristics on customers' loyalty to a store.
This model mines the Customer and Account demographic characteristics of Customers to identify the key attribute influencing the Customer Loyalty scores (RFMP Category Value).
The RFMP algorithms provide functionality to group customers into quartiles, deciles, and quintiles. Each customer falls into one of the following five loyalty categories based on the RFMP quintile he or she belongs to in a particular month:
Group A (RFMP Quintile 5)
Group B (RFMP Quintile 4)
Group C (RFMP Quintile 3)
Group D (RFMP Quintile 2)
Group E (RFMP Quintile 1)
See:
For detailed information about the Customer Loyalty Analysis Model delivered with Oracle Retail Data Model, see the discussion of that model in Oracle Retail Data Model Reference.For this sample report, the presentation of the Rules has been changed to better reflect the Mining Model that the rules are based on. Decision Tree (DT) Rules make sense when displayed in their entirety in the order of the hierarchy (or in the order of the parent or child nodes making up the DT model). Adaptive Bayes (ABN) Rules are independent of each other and do not have a natural display order and can be customized to suit the presentation layer (front-end report) needs.
New report layouts (OBIEE or Oracle Answers reports) displaying the Customer Loyalty Rules or Model Signature.
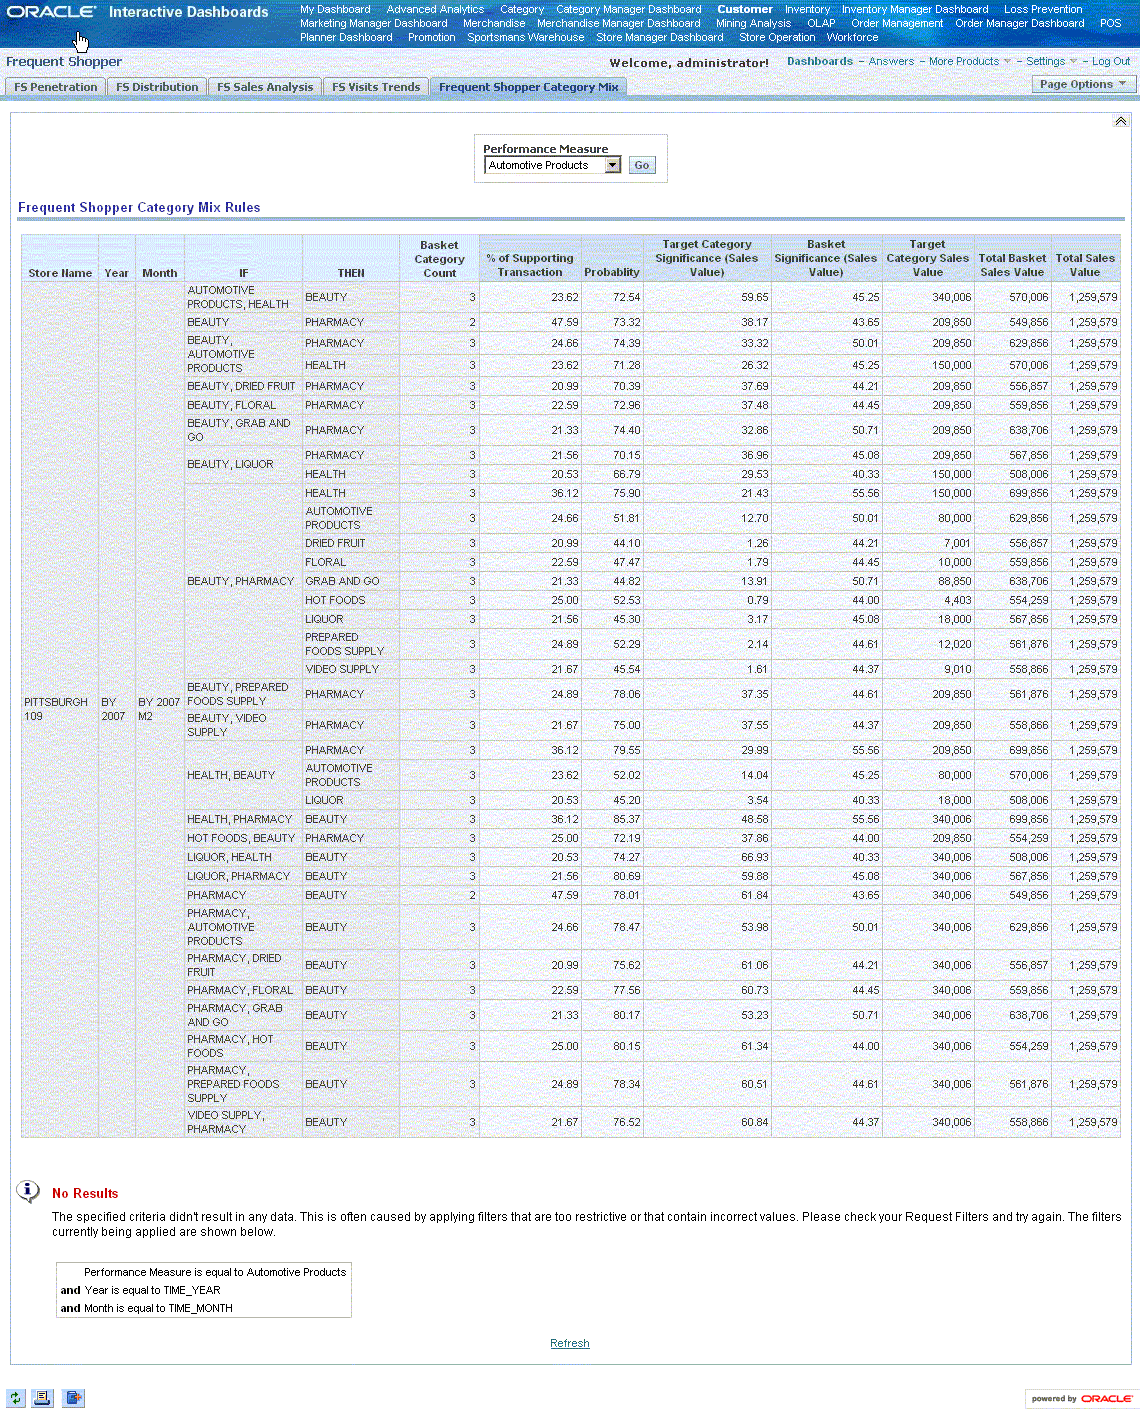
This sample OBIEE report shows Customer Loyalty Rules:
The Sample Item Basket Analysis model addresses the business problem of identifying the extent to which item (product) characteristics influence the items' sales KPIs.
The KPIs are converted into categorical variables using standard database binning operations. The categorical variables are modeled as a classification model in order to identify or predict the impact of various independent variables (attributes) on the dependent target variable (KPI - categorical).
This model identifies which key attributes of an item influence the number of baskets sold, average basket value, and size in a particular store. This model mines the various attributes of items. It takes the binned variables one at a time for Total Basket Count, Average Basket Value, and Average Basket Size as the target variable of an ABN model and DT model with a single feature and discovers rules described in terms of item characteristics.
See:
For detailed information about the Item Basket Analysis Model delivered with Oracle Retail Data Model, see the discussion of that model in Oracle Retail Data Model Reference.For this sample report, the presentation of the Rules has been changed to better reflect the Mining Model that the rules are based on. Decision Tree (DT) Rules make sense when displayed in their entirety in the order of the hierarchy (or in the order of the parent or child nodes making up the DT model). Adaptive Bayes (ABN) Rules are independent of each other and do not have a natural display order and can be customized to suit the presentation layer (front-end report) needs.
The layout of the report is shown in the following sample.
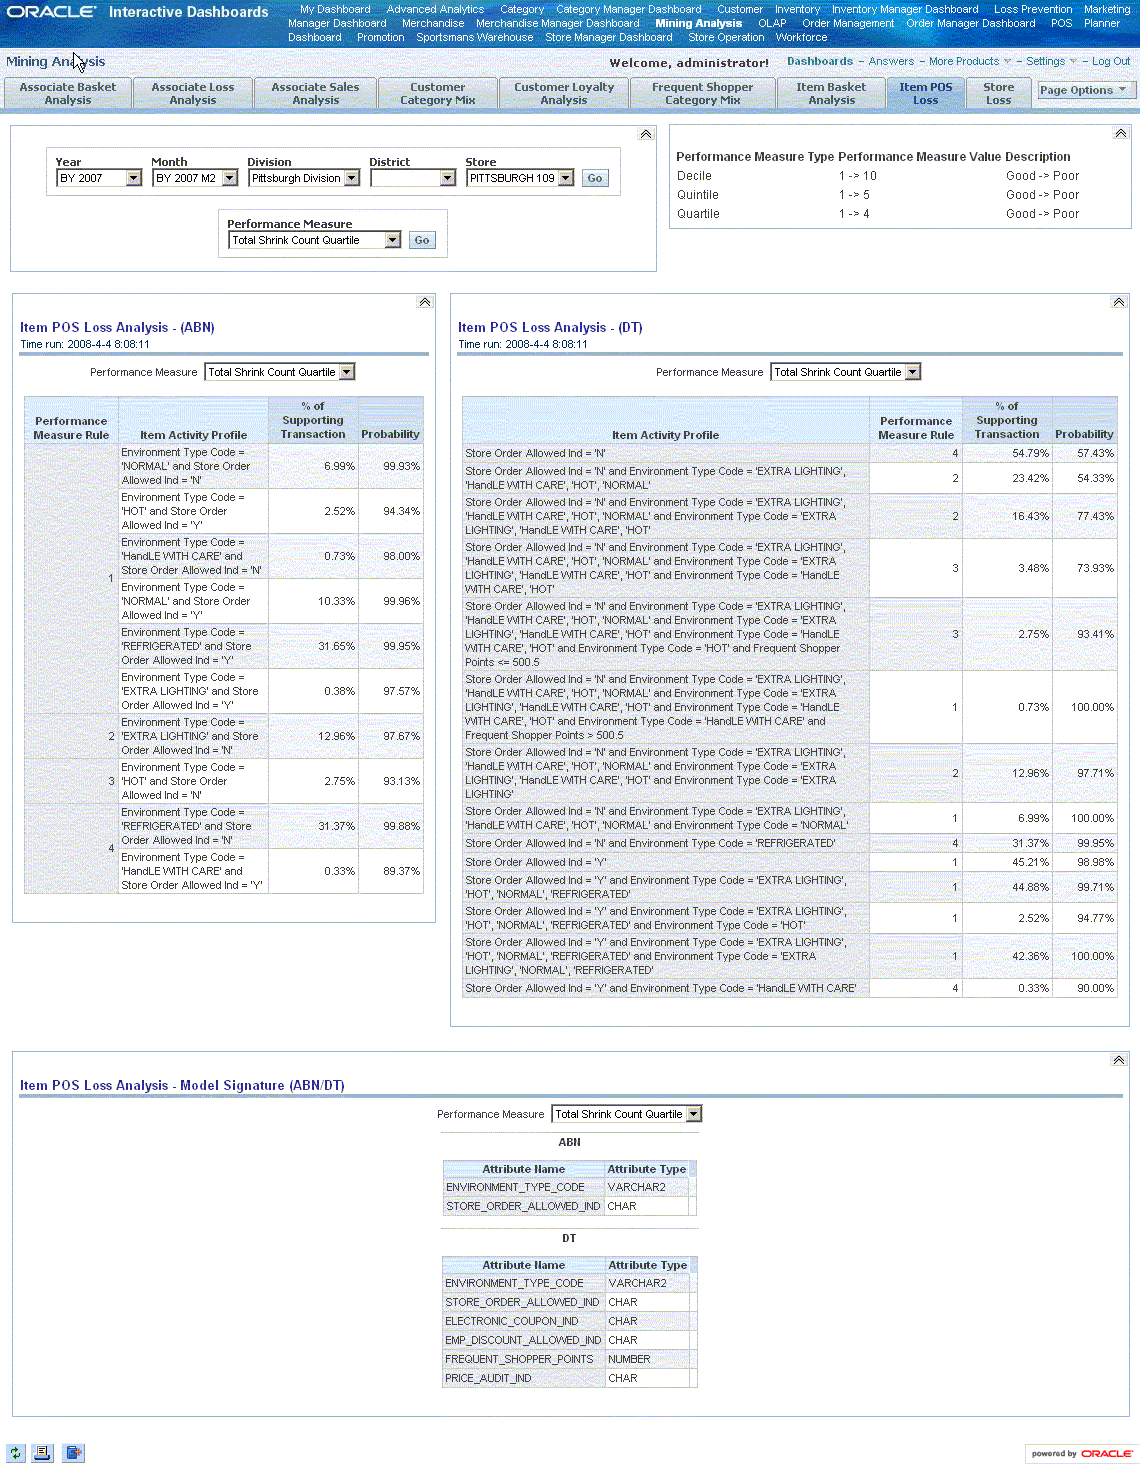
The Item POS Loss Analysis model addresses the business problem of building a profile of item (product) characteristics with regard to POS losses.
The KPIs are converted into categorical variables using standard database binning operations. The categorical variables are modeled as a classification model in order to identify or predict the impact of various independent variables (attributes) on the dependent target variable (KPI - categorical).
This model mines the POS transactions along with the item attributes to identify their impact on Total Shrink Count, Total Shrink Amount, Shrink as a percentage of Sales, Total Theft Count, Total Theft Amount, and Theft as a percentage of Sales.
See:
For detailed information about the Item POS Loss Analysis Model delivered with Oracle Retail Data Model, see the discussion of that model in Oracle Retail Data Model Reference.For this sample report, the presentation of the Rules has been changed to better reflect the Mining Model that the rules are based on. Decision Tree (DT) Rules make sense when displayed in their entirety in the order of the hierarchy (or in the order of the parent or child nodes making up the DT model). Adaptive Bayes (ABN) Rules are independent of each other and do not have a natural display order and can be customized to suit the presentation layer (front-end report) needs.
The following report shows the layout of the report described in this section.
You can use Oracle BI EE Answers and Dashboard presentation tools to customize the predefined sample dashboard reports:
Oracle BI Answers. Provides end user ad hoc capabilities in a pure Web architecture. Users interact with a logical view of the information -- completely hidden from data structure complexity while simultaneously preventing runaway queries. Users can easily create charts, pivot tables, reports, and visually appealing dashboards.
Oracle BI Interactive Dashboards. Provide any knowledge worker with intuitive, interactive access to information. The end user can be working with live reports, prompts, charts, tables, pivot tables, graphics, and tickers. The user has full capability for drilling, navigating, modifying, and interacting with these results.
The bia_rtl and bia_rtl_mining schemas define the relational tables and views in Oracle Retail Data Model. You can use any SQL reporting tool to query and report on these tables and views.
See:
For more information on the relational tables and views, see the discussion of the physical model of the Oracle Retail Data Model in Oracle Retail Data Model Reference.Oracle Retail Data Model supports On Line Analytic Processing (OLAP) reporting through the use of OLAP cubes. The OLAP components of Oracle Retail Data Model are described in "Physical Data Model of the OLAP Component" in Oracle Retail Data Model Reference.
You can query and write reports on these OLAP cubes using SQL tools or OLAP tools. Additionally, when you have installed the Oracle Retail Data Model OLAP component for Oracle Database 11g, you can create an Oracle Business Intelligence Enterprise Edition (OBIEE) repository for the OLAP cubes.
Querying and Reporting on OLAP Cubes Using SQL Tools
The bia_rtl_olap schema that defines the OLAP cubes also defines relational views of the OLAP dimensions and cubes. You can use any SQL reporting tool to query and report on these views. For more information on the relational views of OLAP cube data, see the discussion of the physical model of the OLAP component in Oracle Retail Data Model Reference.
Querying and Reporting on OLAP Cube Data Using OLAP Tools
When you have the Oracle Retail Data Model OLAP component installed, you can write reports on OLAP cubes using OLAP tools. OLAP tools are designed specifically to locate all cubes and dimensions that are accessible to the current user. They automatically use the implicit relationships among cubes, dimensions, hierarchies, levels, and attributes. For example, drilling is automatically supported, children are clearly identified under their parent values, and description attributes are used as labels instead of dimension keys.
See also:
Chapter 5, "Querying Dimensional Objects Using OLAP Tools" in Oracle OLAP Application Developer's Guide which discusses how to use the Oracle Business Intelligence Spreadsheet Add-In with an OLAP cube.Using a OBIEE Repository for OLAP Cubes
When you install the Oracle Retail Data Model OLAP component, a relational view named bia_rtl_olap.OOS_CUBEVIEW view is defined. This relational view is a view of all of the data in the OLAP cubes. You can utilize the bia_rtl_olap.OOS_CUBEVIEW view to create a physical area for the Oracle Retail Data Model OLAP cubes in an Oracle Business Intelligence Enterprise Edition (OBIEE) repository file (that is, an rpd file). Once the OBIEE repository "knows" the OLAP cubes, the OBIEE Server (and therefore any OBIEE client, including as Dashboards, Answers, Delivers and the MS Office Plug-in) to query the ORDM cubes.
Also, when you have installed the Oracle Retail Data Model OLAP component for Oracle Database 11g, you can use the OBIEE Plug-in for Analytic Workspace Manager (AWM) with the Oracle Retail Data Model OLAP Cubes. Using this plug-in you can quickly create an OBIEE repository.
Note:
The OBIEE Plug-in for AWM is available for download from the Oracle Technology Network Web site athttp://www.oracle.com/technology/index.html.There are two OLAP cubes that hold measures that contain time-series and ranking data for sales and inventory: OOS_SALES and OOS_INV. See Oracle Retail Data Model Reference for a list of measures in these cubes.
In Oracle Retail Data Model, OLAP forecasting is performed through OLAP DML programs that call the OLAP DML FORECAST command. Two forecast programs, FORECAST_STOCK_SALES and FORECAST_STOCK_INV, are delivered with Oracle Retail Data Model and reside in the PSLSINV analytic workspace. These default forecast programs are executed during an Oracle Retail Data Model historical load.
By default, the forecast programs use two years of Day level data input and generate a forecast for the third year. The results of the forecasts performed by the default forecast programs are stored as measures in two OLAP cubes for sales and inventory: OOS_SALES_FST and OOS_INV_FST. See Oracle Retail Data Model Reference for a list of measures in these cubes.
The default forecasting programs produce forecasts of the following types and flavors:
Moving average method. Computes a series of averages for the values of a dimensioned variable or expression over a specified dimension. For each dimension value in status, MOVINGAVERAGE computes the average of the data in the range specified, relative to the current dimension value. The default forecast programs produce moving average forecasts of the following "flavors":
Moving average 500
Moving average 3
Moving average 10
Moving average 10 (weekend days)
Moving average 10 (week days)
Trend method. A straight-line extrapolation of historical data. The default forecast programs produce trend forecasts of the following "flavors":
Trend (all days)
Trend (weekend days)
Trend (week days)
Exponential method. An extrapolation of historical data using a constant period-to-period percentage growth. The default forecast programs produce exponential forecasts of the following "flavors":
Exponential (all days
Exponential (weekend days)
Exponential (week days)
The Holt-Winters method. An extrapolation method that allows for both a linear trend and seasonal fluctuations in the data. OLAP first constructs three statistically related series for each time period of the historical data. Oracle OLAP produces a forecast from the three series for the specified number of periods into the future. The default forecast programs produce Holt-Winters forecasts of the following "flavors":
Holt-Wiinters using 364 time periods periodicity (all days)
Holt-Winters using 364 time periods periodicity (weekend days)
Holt-Winters using 364 time periods periodicity (weekdays)