| Oracle® OLAP Application Developer's Guide, 10g Release 2 (10.2) Part Number B14349-05 |
|
|
PDF · Mobi · ePub |
| Oracle® OLAP Application Developer's Guide, 10g Release 2 (10.2) Part Number B14349-05 |
|
|
PDF · Mobi · ePub |
OLAP tools are designed specifically to locate all cubes and dimensions that are accessible to the current user. They automatically use the implicit relationships among cubes, dimensions, hierarchies, levels, and attributes. For example, drilling is automatically supported, children are clearly identified under their parent values, and description attributes are used as labels instead of dimension keys.
This chapter introduces two OLAP querying tools, the Oracle Business Intelligence Spreadsheet Add-In and Discoverer Plus OLAP.
This chapter includes the following topics:
See Also:
OracleBI Spreadsheet Add-In enables analysts to work with live dimensional data in the familiar spreadsheet environment of Microsoft Excel. The Add-In fetches data using an active connection to an OLAP data store, and displays the data in a spreadsheet. Users can use the Add-In to perform OLAP operations such as drilling, rotation, and data selection.
You can obtain the software, tutorials, and documentation from the Oracle Technology Network at
http://www.oracle.com/technetwork/middleware/bi-foundation/downloads/download-088181.html
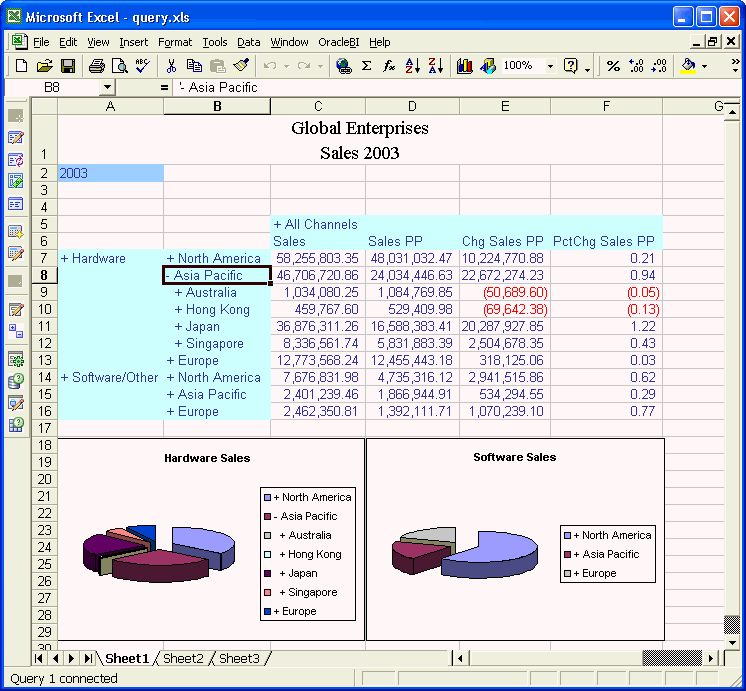
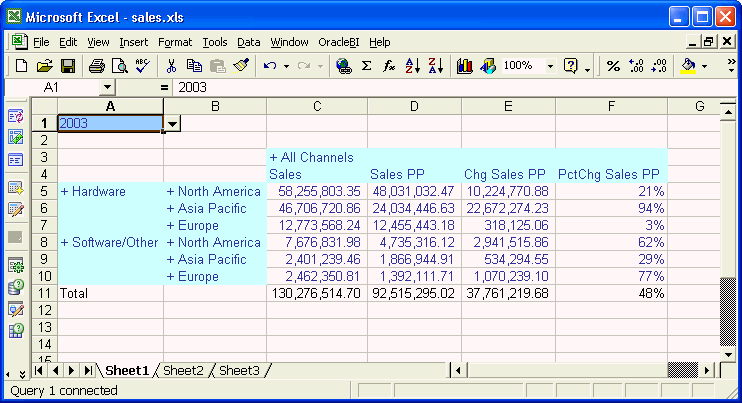
Figure 5-1 shows data from the Global Units Cube displayed in a spreadsheet. The title, data formatting, and pie charts were implemented in Excel. The Add-In maintains a live connection with Oracle Database, which can be reactivated in later sessions. This figure shows the results from a single query, but you can insert numerous queries into a single worksheet.
By clicking a plus (+) next to a dimension member in the crosstab, you can drill down to the contributing members. The charts change dynamically to show the same selection of data as the crosstab. In Figure 5-1, Asia Pacific is expanded under Hardware but not under Software. The difference in data selection appears in the charts also.
Figure 5-1 Displaying Oracle Dimensional Data in a Spreadsheet
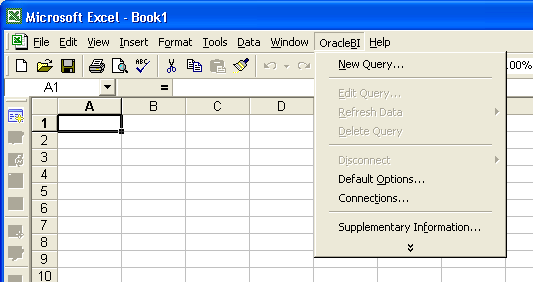
Installation of the Add-In creates a new OracleBI menu on the Excel menu bar, as shown in Figure 5-2. You can add queries to any spreadsheet. The currently selected cell in Excel identifies the upper left cell of the crosstab that will be downloaded from Oracle Database. A warning message appears if the Oracle data will overwrite any data already entered in the spreadsheet.
On the OracleBI menu, click Supplementary Information for links to the tutorials and demonstrations. The Online Tutorial provides detailed instructions for the tasks shown briefly in this chapter.
The Spreadsheet Add-In uses the same query wizard as the Measure Viewer in Analytic Workspace Manager. You select the measures, the layout, and the dimension members. The first page of the wizard lists all the measures that you have privileges to query.
On the OracleBI menu, choose New Query.
The Connect Query to Oracle OLAP Data Source dialog box opens.
On the Connection Editor tab, define a connection to Oracle Database.
Click Help for information about your choices.
On the OLAP Connection tab, provide your credentials to log in to Oracle Database.
The OracleBI Query Wizard opens.
Follow the steps of the wizard. When you are done, the data is displayed in Excel.
Choose Edit Query from the OracleBI menu, if you want to change the data selection or any other aspect of the query.
If this choice is not available, click any cell with data returned by the query.
Figure 5-3 shows the first page of the Query Wizard. In this example, a measure folder named "Global Enterprises" contains the measures and calculated measures in the Global analytic workspace.
Figure 5-3 Selecting Measures in the Query Wizard
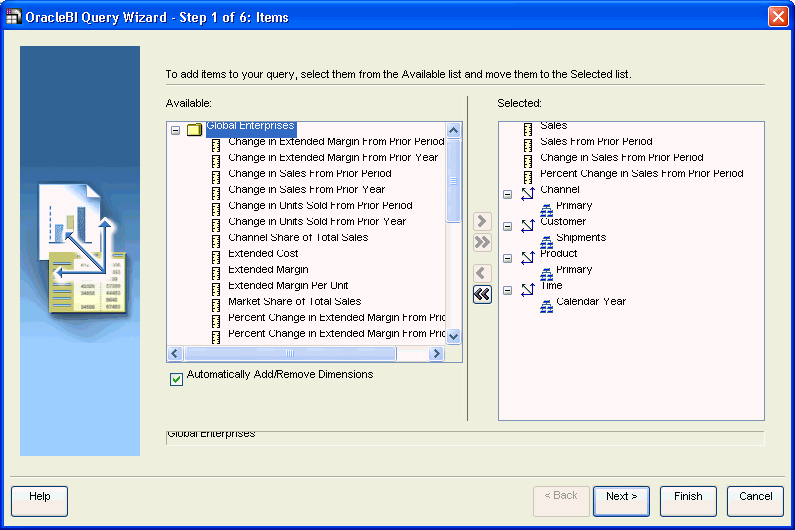
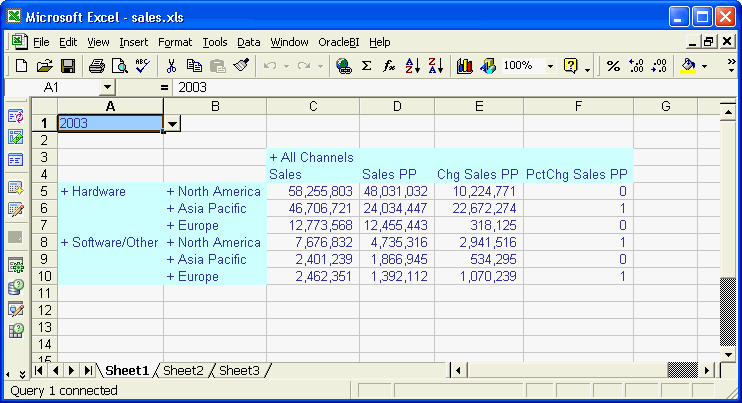
Figure 5-4 shows the downloaded data from Oracle. It appears with the default Excel formatting for the font, size, justification, decimal places, and so forth.
Figure 5-4 Oracle Data Downloaded to a Spreadsheet
You can change all of the default settings in Excel the same as for any other data. Figure 5-5 shows the same data as Figure 5-4, but with the following changes:
All data is displayed to two decimal places after using the Increase Decimal tool on the Excel toolbar.
The PctChg Sales PP column displays the data as percentages instead of decimals after using the Percent Style tool.
A new row contains data calculated in Excel using the Sum function on Sales, Sales PP, and Chg Sales PP, and the Average function on PctChg Sales PP. The row has the label "Total."
You can also add charts in Excel using the Chart Wizard. Figure 5-1 shows the addition of two pie charts.
Figure 5-5 Using Excel to Format the Data
Discoverer Plus OLAP provides various wizards to guide you through the entire process of building and publishing sophisticated reports containing crosstabs and graphs. You can choose from multiple layout options to create a visual representation of the query results. You can create queries, drill, pivot, slice and dice data, add analytic calculations, graph the data, share results with other users, and export your Discoverer reports in various data formats. Discoverer reports can also be published in dashboards where other users can access them from their browsers.
You can obtain the software, tutorials, and documentation from the Oracle Technology Network at
http://www.oracle.com/technetwork/developer-tools/discoverer/overview/index.html
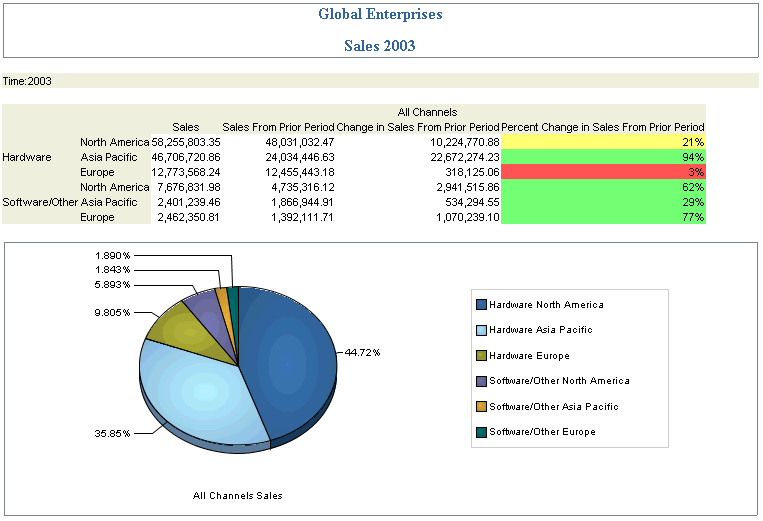
Figure 5-6 shows a report developed in Discoverer, exported in HTML format, and displayed in a browser.
Figure 5-6 Sales Report Generated by Discoverer Plus OLAP
Discoverer organizes worksheets into workbooks, like a spreadsheet package. After you open Discoverer and log in, the Workbook Wizard opens automatically, as shown in Figure 5-7. You can open an existing workbook, or you can create a new workbook and define the contents of the first worksheet.
Figure 5-7 Defining a New Discoverer Workbook
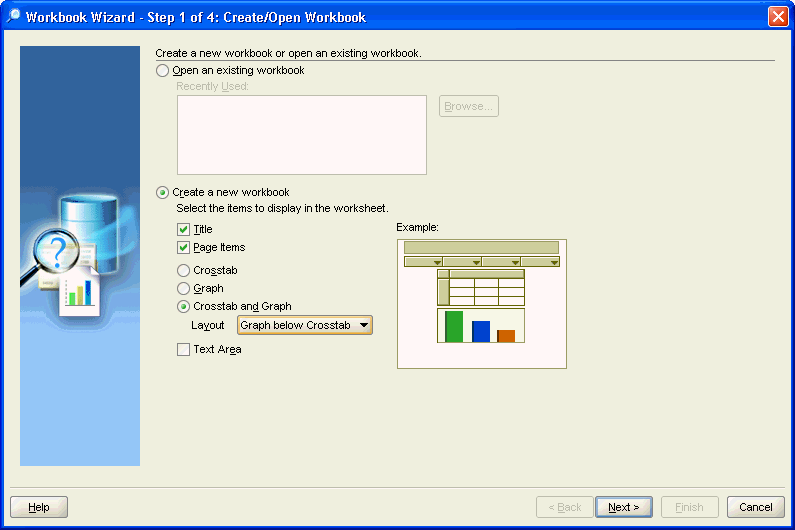
When creating a new worksheet, you can specify in the first step of the Workbook Wizard which options you want, such as a title or a graph. The wizard then steps you through the creation of these options. You can add or delete these optional components at any time.
The Workbook Wizard uses the same query wizard as the Spreadsheet Add-In and the Measure Viewer in Analytic Workspace Manager. You select the measures, the layout, and the dimension members.
To create a new workbook and a worksheet:
Open Discoverer Plus OLAP and log in to Oracle Database.
The Workbook Wizard opens to the Create/Open Workbook page.
Select Create a New Workbook, the select the optional components of the first worksheet.
Follow the steps of the wizard. When you are done, the data is displayed in the main window as a crosstab, or a graph, or both.
Modify the worksheet as you like, changing the data selection or the data formats, adding calculations, and so forth.
To add another worksheet to the workbook, choose Add Worksheet from the Edit menu.
Figure 5-8 shows a worksheet that was defined in the Workbook Wizard. It appears with the default formatting for the font, justification, decimal places, and so forth.
Figure 5-8 Default Query Results in Discoverer
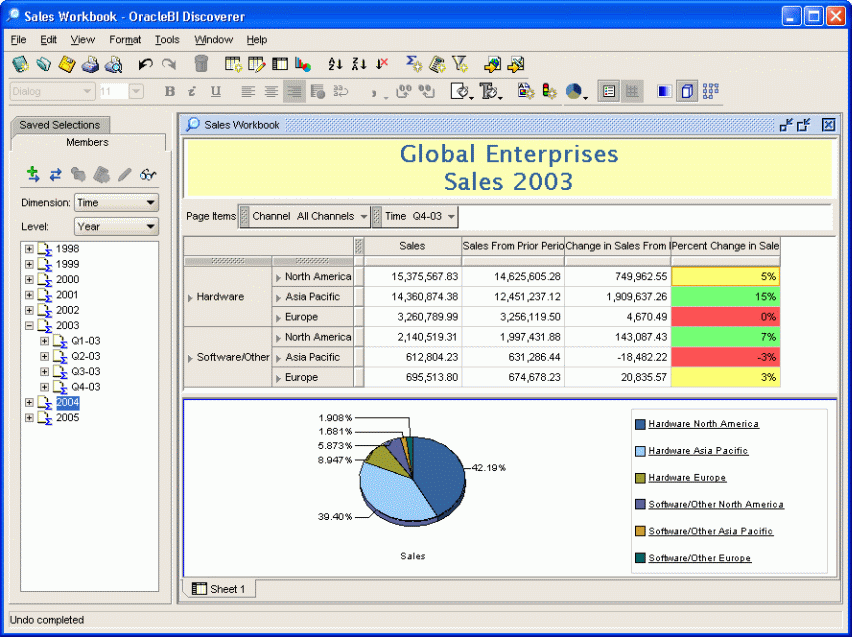
You can change every aspect of the query and its formatting using the menus and toolbars. Figure 5-9 shows the same basic query as Figure 5-8, but with the following changes:
A new title appears in a custom font and background color. Click the default title.
All data is displayed to two decimal places. Use the Add Decimal tool.
The Percent Change in Sales From Prior Period column displays the data as percentages instead of decimals. Use the Format As Percent tool.
Stoplight formatting of the Percent Change in Sales From Prior Period column highlights products that are outside the target range in some areas. Select New Stoplight Format from the Format menu.
The Time selection changed from 2003 to Q4-03. Use the Members tab on the Available Items pane.
A pie chart for Sales replaced the bar charts for all measures. Use the Edit Graph Type and Properties tool.
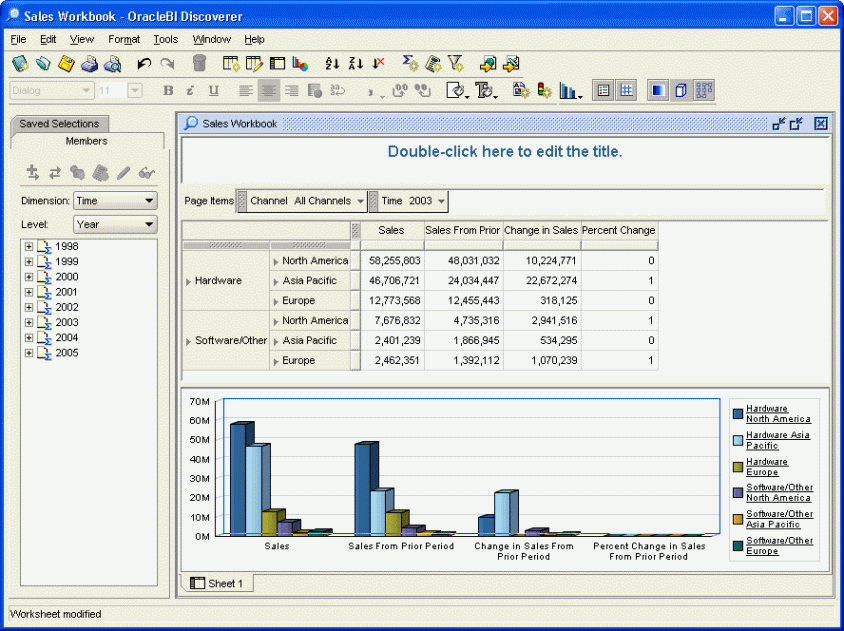
You can also perform calculations on the data, define new calculated measures, and create saved selections of dimension members.
Figure 5-9 Changing the Default Formatting in Discoverer
|
Copyright © 2003, 2012, Oracle and/or its affiliates. All rights reserved. Legal Notices |
|