| Oracle® OLAP Application Developer's Guide, 10g Release 2 (10.2) Part Number B14349-05 |
|
|
PDF · Mobi · ePub |
| Oracle® OLAP Application Developer's Guide, 10g Release 2 (10.2) Part Number B14349-05 |
|
|
PDF · Mobi · ePub |
This chapter introduces the powerful analytic resources available in Oracle Database 10g installed with the OLAP option. It consists of the following topics:
Oracle Database offers the industry's first and only embedded OLAP server. Oracle OLAP provides native multidimensional storage and speed-of-thought response times when analyzing data across multiple dimensions. The database provides rich support for analytics such as time series calculations, forecasting, advanced aggregation with additive and nonadditive operators, and allocation operators. These capabilities make the Oracle database a complete analytical platform, capable of supporting the entire spectrum of business intelligence and advanced analytical applications.
By integrating multidimensional objects and analytics into the database, Oracle provides the best of both worlds: the power of multidimensional analysis along with the reliability, availability, security, and scalability of the Oracle database.
Oracle OLAP is fully integrated into Oracle Database. At a technical level, this means:
The OLAP engine runs within the kernel of Oracle Database.
Dimensional objects are stored in Oracle Database in their native multidimensional format.
Applications can query dimensional objects using either SQL or Java.
The benefits to your organization are significant. Oracle OLAP offers the power of simplicity: One database, standard administration, standard interfaces and development tools.
Because Oracle OLAP is completely embedded in the Oracle database, there is no administration learning curve as is typically associated with standalone OLAP servers. You can leverage your existing DBA staff, rather than invest in specialized administration skills.
With Oracle OLAP, standard Oracle Database security features are used to secure your multidimensional data.
In contrast, with a standalone OLAP server, administrators must manage security twice: once on the relational source system and again on the OLAP server system. Additionally, they must manage the security of data in transit from the relational system to the standalone OLAP system.
Business intelligence and analytical applications are dominated by actions such as drilling up and down hierarchies and comparing aggregate values such as period-over-period, share of parent, projections onto future time periods, and a myriad of similar calculations. Often these actions are essentially random across the entire space of potential hierarchical aggregations. Because Oracle OLAP precomputes or efficiently computes on the fly all aggregates in the defined multidimensional space, it delivers unmatched performance for typical business intelligence applications.
When Oracle Database is installed with Oracle Real Application Clusters (Oracle RAC), OLAP applications receive the same benefits in performance, scalability, fail over, and load balancing as any other application.
These features add up to reduced costs. Administrative costs are reduced because existing personnel skills can be leveraged. Standard security reduces administration costs as well. Hardware costs are reduced by Oracle OLAP's efficient management of aggregations and Oracle RAC, which enables highly scalable systems to be built from low-cost commodity components.
Multidimensional data is stored in analytic workspaces, where it can be manipulated by the OLAP engine in Oracle Database. Individual analytic workspaces are stored in tables in a relational schema, and they can be managed like other relational tables. An analytic workspace is owned by a particular user ID, and other users can be granted access to it. Within a single database, many analytic workspaces can be created and shared among users.
Analytic workspaces have been designed explicitly to handle multidimensionality in their physical data storage and manipulation of data. The multidimensional technology that underlies analytic workspaces is based on an indexed multidimensional array model, which provides direct cell access. This intrinsic multidimensionality affords analytic workspaces much of their speed and power in performing multidimensional analysis.
Creating an analytic workspace involves a physical transformation of the data. The first step in that transformation is defining dimensional objects such as measures, dimensions, levels, hierarchies, and attributes. Afterward, you can map the dimensional objects to the data sources. The analytic workspace instantiates the logical objects as physical objects, and the data loading process transforms the data from a relational format into a dimensional format.
The analytic workspaces that are created by Oracle Warehouse Manager and Analytic Workspace Manager are in database standard form (typically called simply "standard form"). Standard form specifies the types of physical objects that are used to instantiate logical objects (such as dimensions and measures), and the type, form, and storage location of the metadata that describes these logical objects.
This metadata is exposed to SQL in the Active Catalog. The Active Catalog is composed of views of standard form metadata that is stored in analytic workspaces. These views are maintained automatically, so that a change to a standard form analytic workspace is reflected immediately by a change to the Active Catalog. Discoverer Plus OLAP and Spreadsheet Add-In use the Active Catalog to query data in analytic workspaces.
The dimensional data model is highly structured. Structure implies rules that govern the relationships among the data and control how the data can be queried. Analytic workspaces are the physical implementation of the dimensional model, and thus are highly optimized for dimensional queries. The OLAP engine leverages the model in performing highly efficient cross-cube joins (for inter-row calculations), outer joins (for time series analysis), and indexing. Dimensions are pre-joined to the measures.
For data stored in analytic workspaces, the OLAP calculation engine performs analytic operations and supports sophisticated analysis, such as modeling and what-if analysis. If you require these types of analysis, then you need analytic workspaces. The OLAP engine also provides the fastest run-time response to analytic queries, which is important if you anticipate user sessions that are heavily analytical.
A basic characteristic of business analysis is hierarchically structured data; detail data is summarized at various levels, which allows trends and patterns to emerge. An analyst who has detected a pattern can drill down to lower levels to identify the factors that contributed to this pattern.
The creation and maintenance of summary data is a serious issue for DBAs. If no summary data is stored, then all summarizations must be performed in response to individual queries. This can easily result in unacceptably slow response time. At the other extreme, if all summary data is stored, then the database can quickly multiply in size.
Analytic workspaces store aggregate data in the same objects as the base level data. Aggregates can be stored permanently in the analytic workspace, or only for the duration of an individual session, or only for a single query. Aggregation rules identify which aggregates are stored for each measure. When an application queries the analytic workspace, either the aggregate values have already been calculated and can simply be retrieved, or they can be calculated on the fly from a small number of stored aggregates. The data is always presented to the application as fully solved; that is, both detail and summary values are provided, without requiring that calculations be specified in the query. Analytic workspaces are optimized for multidimensional calculations, making run-time summarizations extremely fast.
Analytic workspaces provide an extensive list of aggregation methods, including weighted, hierarchical, and weighted hierarchical methods.
Analysts can choose any SQL query and analysis tool for selecting, viewing, and analyzing the data. You can use your favorite tool or application, or use one of the tools supplied with Oracle Database.
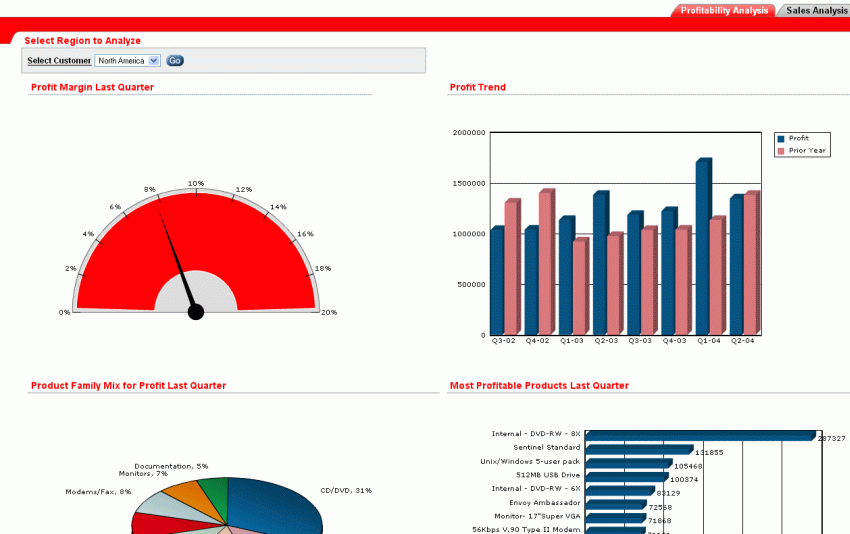
Figure 1-1 displays a portion of a dashboard created in Oracle Application Express, which is distributed with Oracle Database. Application Express generates HTML reports that display the results of SQL queries. It only understands SQL; it has no special knowledge of dimensional objects.
This dashboard demonstrates information-rich calculations such as ratio, share, prior period, and cumulative total. Separate tabs on the dashboard present Profitability Analysis and Sales Analysis. Each tab presents the data in dials, bar charts, horizontal bar charts, pie charts, and cross-tabular reports. A drop-down list in the upper left corner provides a choice of Customers.
The dial displays the quarterly profit margin. To the right is a bar chart that compares current profits with year-ago profits.
Figure 1-1 Dashboard Created in Oracle Application Express
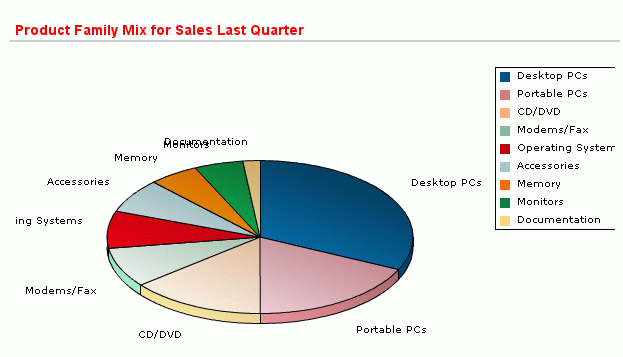
The pie chart in Figure 1-2 displays the percent share that each product family contributed to the total profits in the last quarter.
Figure 1-2 Contributions of Product Families to Total Profits
The horizontal bar chart in Figure 1-3 displays ranked results for locations with the largest gains in profitability from a year ago. Decision makers can see at a glance how each location improved by the last quarter.
Figure 1-3 Geographic Locations Ranked by Profit
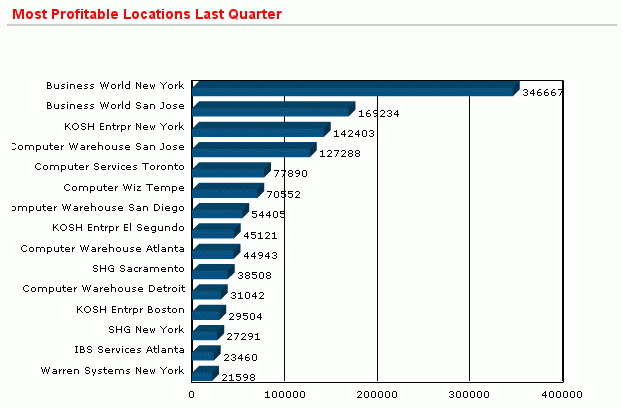
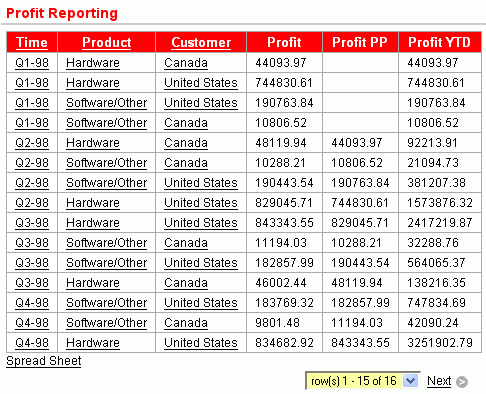
Figure 1-4 compares current profits with prior period and year-to-date profits. The cross-tabular report features interactive drilling, so that decision makers can easily see the detailed data that contributed to a parent value of interest.
Figure 1-4 Comparison of Current Profits With Other Time Periods
Analysts can choose between two query and analysis tools developed specifically for selecting, viewing, and analyzing dimensional data:
OracleBI Spreadsheet Add-In
OracleBI Discoverer Plus OLAP
In addition, OracleBI Beans is available for developing custom applications, as described in Chapter 11.
Both Discoverer Plus OLAP and Spreadsheet Add-In use a dimensional data model so that analysts can formulate their queries in the language of business. Dimensions provide the context for the data. Consider the following request for information:
For fiscal years 2003 and 2004, show the percent change in sales for the top 10 products for each of the top 10 customers based on sales.
The sales measure is dimensioned by time periods, products, and customers. This request is articulated in business terms, but easily translates into a query in the language of dimensional analysis: dimensions, levels, hierarchies, and attributes.
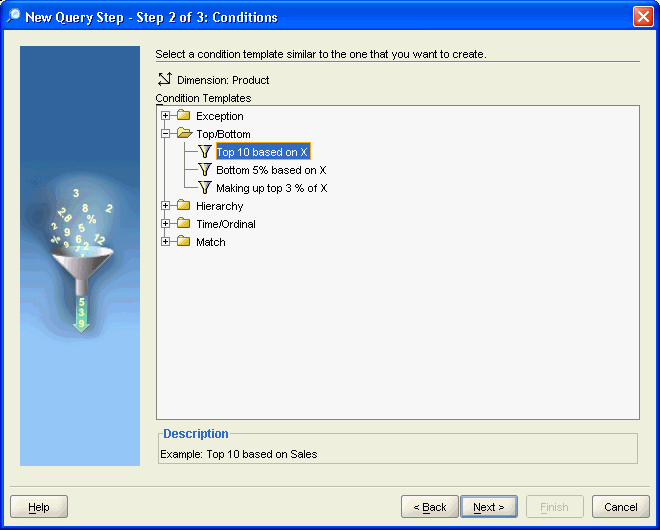
Figure 1-5 shows a step in the Query Wizard in Discoverer Plus OLAP for selecting the top 10 products. The Query Wizard assists users in selecting by criteria, by value, and by saved selections. All OLAP tools provide a Query Wizard to assist users in formulating these queries.
Figure 1-5 Selecting Dimension Values By Criteria
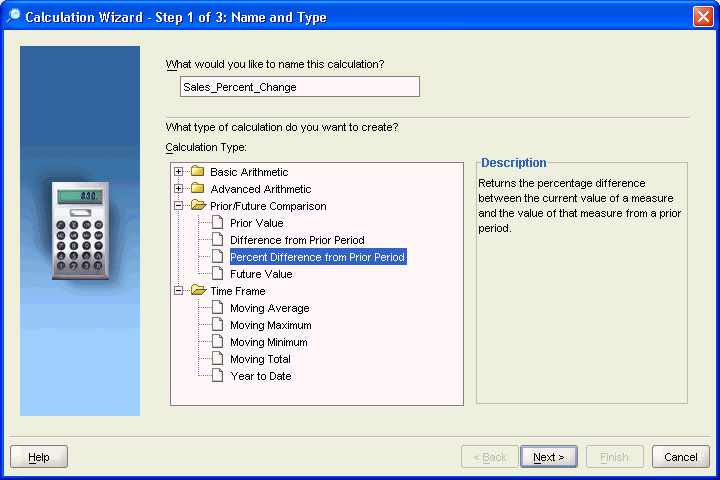
Multidimensional data types facilitate the creation of calculations. From the measures stored in your data warehouse, you can use numerous operators and functions to generate a wealth of information. In addition to the calculated measures created by the DBA as part of an analytic workspace, users can create their own calculations. Figure 1-6 shows a step in the Calculation Wizard of Discoverer Plus OLAP for calculating percent change in sales. Spreadsheet Add-In has the same Calculation Wizard.
Figure 1-6 Choosing a Calculation Method for a Custom Measure
The dimensional data model is an integral part of On-Line Analytical Processing, or OLAP. Because OLAP is on-line, it must provide answers quickly; analysts pose iterative queries during interactive sessions, not in batch jobs that run overnight. And because OLAP is also analytic, the queries are complex.
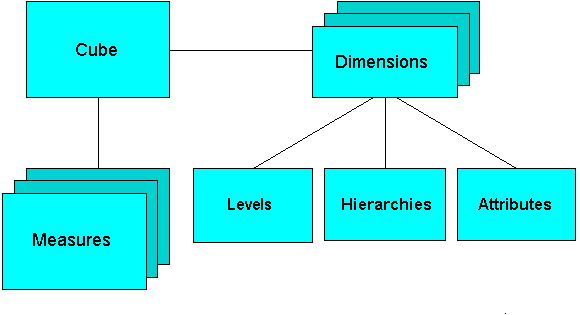
The dimensional data model is composed of cubes, measures, dimensions, hierarchies, levels, and attributes. The simplicity of the model is inherent because it defines objects that represent real-world business entities. Analysts know which business measures they are interested in examining, which dimensions and attributes make the data meaningful, and how the dimensions of their business are organized into levels and hierarchies.
Figure 1-7 shows the general relationships among objects.
Figure 1-7 Diagram of the OLAP Dimensional Model
Cubes provide a means of organizing measures that have the same shape, that is, they have the exact same dimensions. Measures in the same cube have the same relationships to other objects and can easily be analyzed and displayed together.
Measures populate the cells of a cube with the facts collected about business operations. Measures are organized by dimensions, which typically include a Time dimension.
An analytic database contains snapshots of historical data, derived from data in a transactional database, legacy system, syndicated sources, or other data sources. Three years of historical data is generally considered to be appropriate for analytic applications.
Measures are static and consistent while analysts are using them to inform their decisions. They are updated in a batch window at regular intervals: weekly, daily, or periodically throughout the day. Some administrators refresh their data by adding periods to the time dimension of a measure, and may also roll off an equal number of the oldest time periods. Each update provides a fixed historical record of a particular business activity for that interval. Other administrators do a full rebuild of their data rather than performing incremental updates.
A critical decision in defining a measure is the lowest level of detail. Users may never view this base level data, but it determines the types of analysis that can be performed. For example, market analysts (unlike order entry personnel) do not need to know that Beth Miller in Ann Arbor, Michigan, placed an order for a size 10 blue polka-dot dress on July 6, 2005, at 2:34 p.m. But they might want to find out which color of dress was most popular in the summer of 2005 in the Midwestern United States.
The base level determines whether analysts can get an answer to this question. For this particular question, Time could be rolled up into months, Customer could be rolled up into regions, and Product could be rolled up into items (such as dresses) with an attribute of color. However, this level of aggregate data could not answer the question: At what time of day are women most likely to place an order? An important decision is the extent to which the data has been aggregated before being loaded into a data warehouse.
Dimensions contain a set of unique values that identify and categorize data. They form the edges of a cube, and thus of the measures within the cube. Because measures are typically multidimensional, a single value in a measure must be qualified by a member of each dimension to be meaningful. For example, the Sales measure has four dimensions: Time, Customer, Product, and Channel. A particular Sales value (43,613.50) only has meaning when it is qualified by a specific time period (Feb-01), a customer (Warren Systems), a product (Portable PCs), and a channel (Catalog).
A hierarchy is a way to organize data at different levels of aggregation. In viewing data, analysts use dimension hierarchies to recognize trends at one level, drill down to lower levels to identify reasons for these trends, and roll up to higher levels to see what affect these trends have on a larger sector of the business.
Each level represents a position in the hierarchy. Each level above the base (or most detailed) level contains aggregate values for the levels below it. The members at different levels have a one-to-many parent-child relation. For example, Q1-05 and Q2-05 are the children of 2005, thus 2005 is the parent of Q1-05 and Q2-05.
Suppose a data warehouse contains snapshots of data taken three times a day, that is, every 8 hours. Analysts might normally prefer to view the data that has been aggregated into days, weeks, quarters, or years. Thus, the Time dimension needs a hierarchy with at least five levels.
Similarly, a sales manager with a particular target for the upcoming year might want to allocate that target amount among the sales representatives in his territory; the allocation requires a dimension hierarchy in which individual sales representatives are the child values of a particular territory.
Hierarchies and levels have a many-to-many relationship. A hierarchy typically contains several levels, and a single level can be included in multiple hierarchies.
Although hierarchies are typically composed of levels, they do not have to be. The parent-child relations among dimension members may not define meaningful levels. For example, in an employee dimension, each manager has one or more reports, which forms a parent-child relation. Creating levels based on these relations (such as individual contributors, first-level managers, second-level managers, and so forth) may not be meaningful for analysis. Likewise, the line item dimension of financial data does not have levels. This type of hierarchy is called a value-based hierarchy.
An attribute provides additional information about the data. Some attributes are used for display. For example, you might have a product dimension that uses Stock Keeping Units (SKUs) for dimension members. The SKUs are an excellent way of uniquely identifying thousands of products, but are meaningless to most people if they are used to label the data in a report or a graph. You would define attributes for the descriptive labels.
You might also have attributes like colors, flavors, or sizes. This type of attribute can be used for data selection and answering questions such as: Which colors were the most popular in women's dresses in the summer of 2005? How does this compare with the previous summer?
Time attributes can provide information about the Time dimension that may be useful in some types of analysis, such as identifying the last day or the number of days in each time period.
If you created an analytic workspace in Oracle 10g Release 1, you can upgrade it to Release 2 using the following procedure. Upgrading is optional. However, upgrading enables you to use the new features of Analytic Workspace Manager 10.2, such as additional aggregation operators for compressed composites, support for multiple languages, and performance improvements.
To upgrade an analytic workspace, take these steps:
Open Analytic Workspace Manager in the Model View.
In the navigation tree, select the name of the Oracle Database instance where your analytic workspace is stored.
On the Basic tab of the Database property sheet, verify that the database is running in 10.2 compatibility mode.
Right-click the analytic workspace, and select Upgrade Analytic Workspace to 10.2.
Complete the Analytic Workspace Upgrade to Version 10.2 dialog box.
Click Help for additional information.
If you have analytic workspaces that were created in Oracle9i, then you should upgrade them to take advantage of new features such as partitioning and compressed composites.
Upgrading may break custom OLAP DML programs. For this reason, you can choose to upgrade at a time that is convenient for you. You can continue to manage your older analytic workspaces by using an older version of Analytic Workspace Manager (such as Oracle9i Release 9.2.0.4.1).
Any new analytic workspaces that you create using the new Oracle Database 10g version of Analytic Workspace Manager is automatically in 10g standard form, as long as Oracle Database is running in 10g compatibility mode.
If Oracle Database is running in 9i compatibility mode, then you continue to work the same way as before without upgrading the analytic workspaces.
To upgrade an analytic workspace, take these steps:
Set the COMPATIBLE parameter to 10.0.0.0 or later in the database initialization file.
Upgrade the physical storage format.
Upgrade the standard form metadata.
You can upgrade the physical storage format without upgrading the standard form metadata, if you wish. This change improves performance and supports partitioning. However, the analytic workspace is not enabled dynamically for OracleBI Beans until you upgrade the metadata.
You can perform the upgrade steps either in the Object View of Analytic Workspace Manager or in PL/SQL.
Convert the physical storage format by using either of these methods:
Recreate the analytic workspace by following these steps:
Export the contents to an EIF file.
Delete the old analytic workspace.
Create a new, empty analytic workspace.
Import the contents from the EIF file.
You can export and import in Analytic Workspace Manager. For more information, see these topics in Help: "Exporting Workspace Objects" and "Importing Workspace Objects"
Use the PL/SQL conversion program:
EXECUTE dbms_aw.convert('aw_name');
Tip: Use a program such as SQL*Plus to execute this procedure. For the full syntax, refer to the Oracle OLAP Reference.
To upgrade the standard form metadata, follow these steps:
In Analytic Workspace Manager, open the Object View.
Expand the navigation tree until you see the name of the analytic workspace.
Right-click the analytic workspace and choose Upgrade Analytic Workspace From 9i to 10g Standard Form from the popup menu.
Upgrade to Release 2 by following the instructions in "Upgrading Oracle Database 10g Release 1 Analytic Workspaces".