| Oracle® Retail Data Model Reference Release 11.3.2 E20361-03 |
|
|
PDF · Mobi · ePub |
| Oracle® Retail Data Model Reference Release 11.3.2 E20361-03 |
|
|
PDF · Mobi · ePub |
This chapter provides additional Oracle Retail Data Model sample reports.
This chapter includes the following sections:
Workforce includes the following areas:
Ranking includes the Salesperson Performance, Salesperson Ranking, Salesperson Profit, and Cashier.
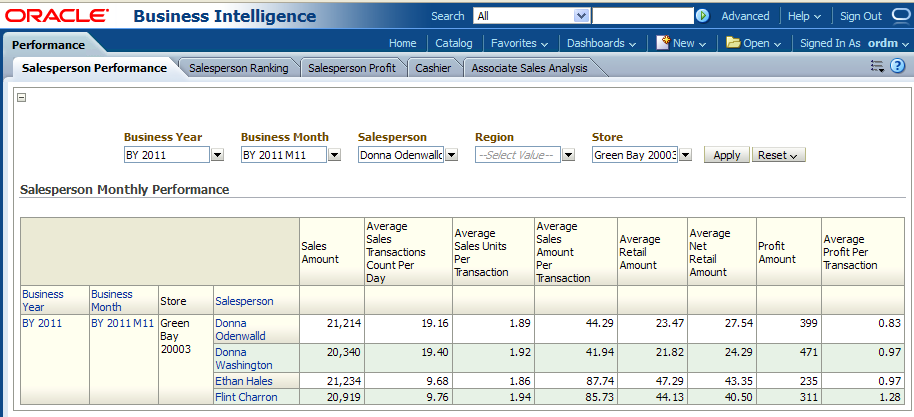
This report, as shown in Figure 13-1 provides monthly performance of sales person using sales measures. The report is used to identify the most or least productive salesperson.
Report dimensions are:
Business Time
Organization
Salesperson
Figure 13-1 Salesperson Monthly Performance Report
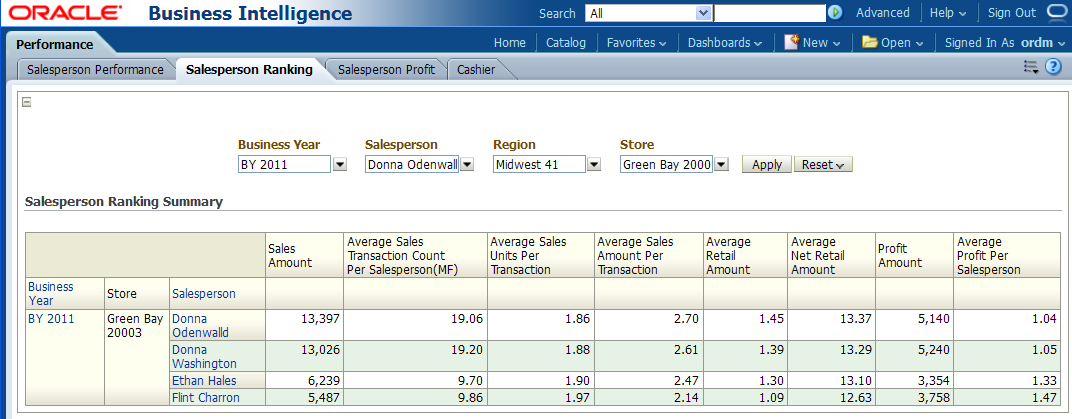
This report, as shown in Figure 13-2 provides salesperson ranking information based on the top sales value for each location. The report is used to identify the most or least productive salesperson in a particular location.
Report dimensions are:
Business Time
Organization
Salesperson
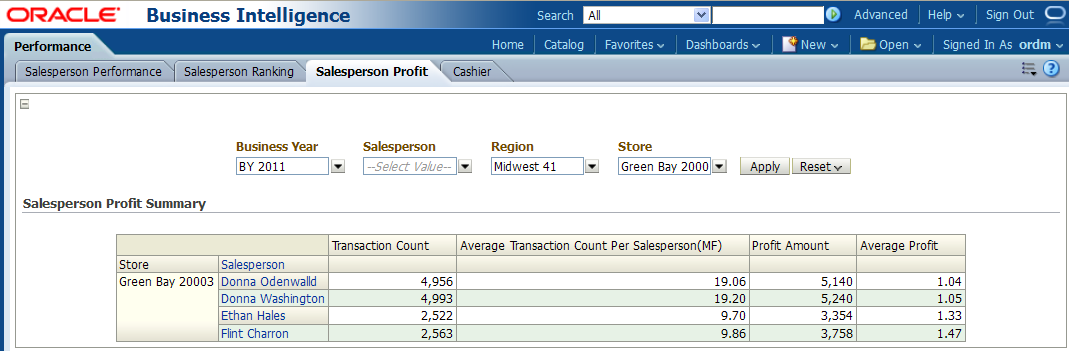
This report, as shown in Figure 13-3 provides salesperson productivity record, based on transaction and profit measures over time.
The report is used to identify the most or least profitable salesperson.
Report dimensions are:
Business Time
Organization
Salesperson
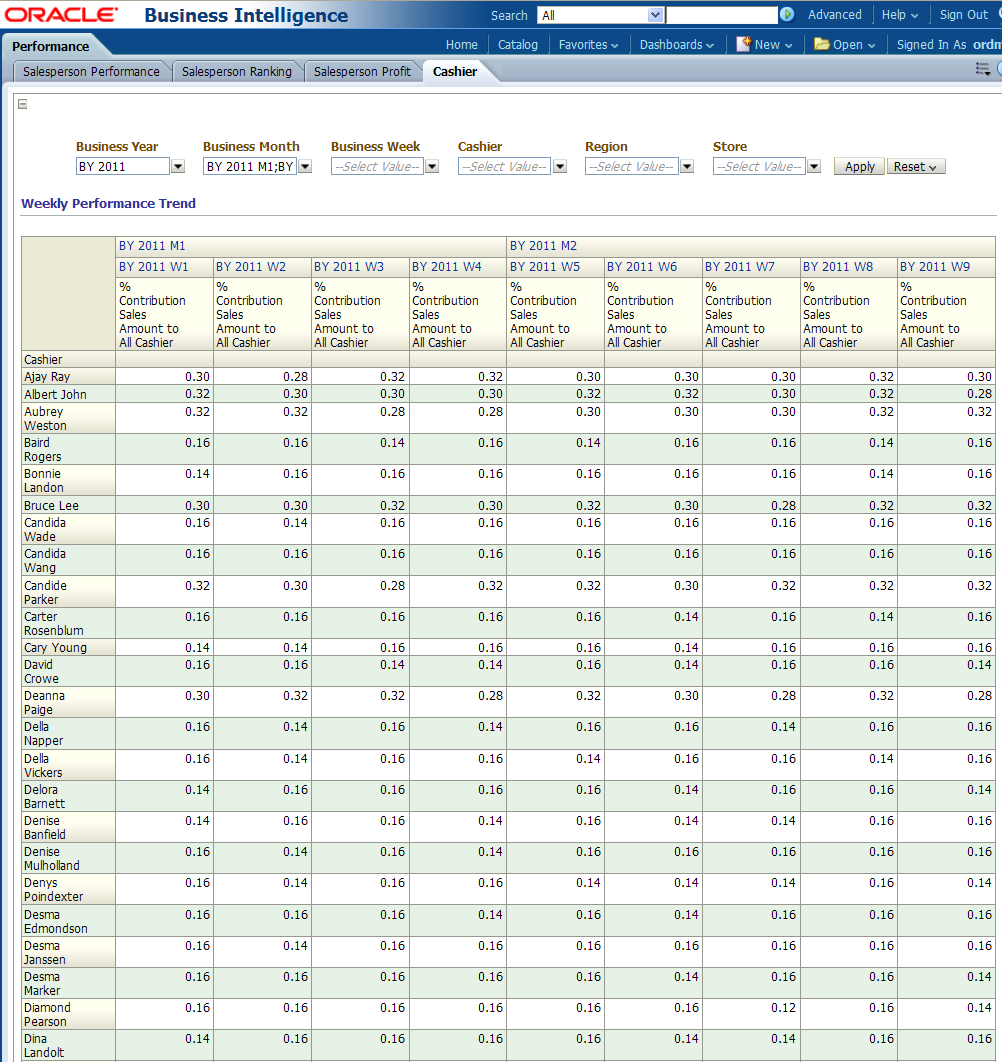
This report, as shown in Figure 13-4 provides contribution of cashiers to all cashiers. The report is used to identify the most or least productive cashiers.
Report dimensions are:
Business Time
Organization
Cashier
Figure 13-4 Workforce Performance Cashier Report
Ranking includes the Cashier Ranking and Salesperson Ranking.
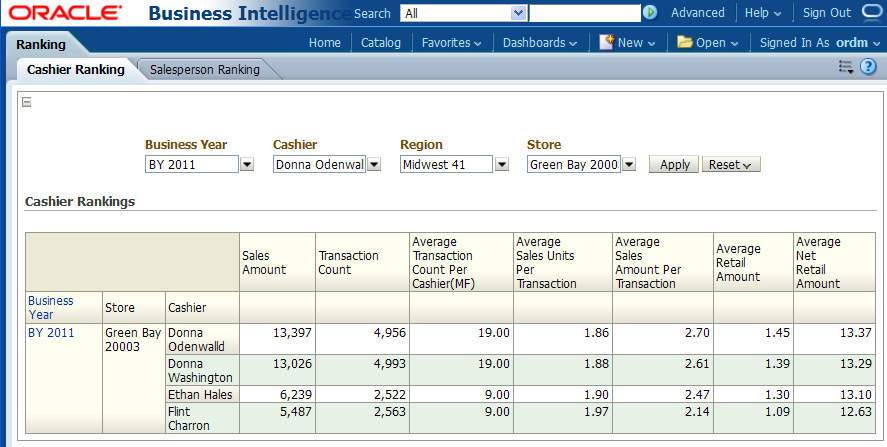
This report, as shown in Figure 13-5 provides cashier ranking information based on the top sales value for each location. The report is used to identify the most or least productive cashiers in a particular location.
Report dimensions are:
Business Time
Organization
Cashier
Figure 13-5 Workforce Ranking Cashier Ranking Report
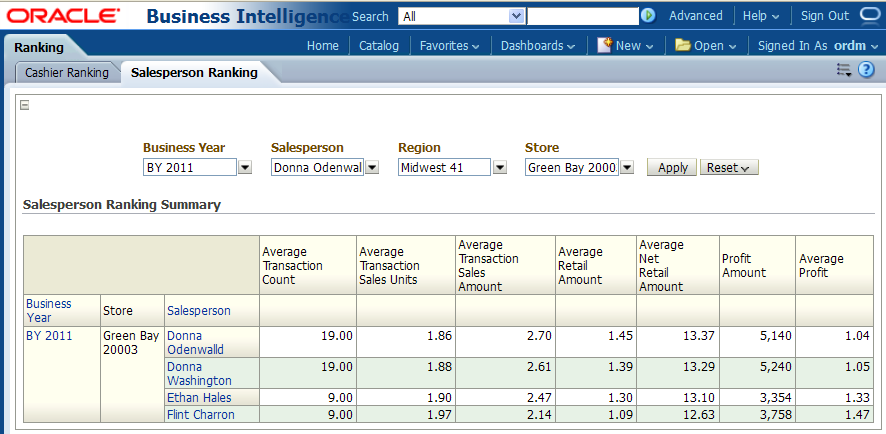
This report, as shown in Figure 13-6 provides salesperson ranking information based on the top sales value for each location. The report is used to identify the most or least productive cashiers in a particular location.
Report dimensions are:
Business Time
Organization
Salesperson
Figure 13-6 Workforce Salesperson Ranking Report
Transactions includes the Employees Sales and Returns and Cashier Transaction Summary.
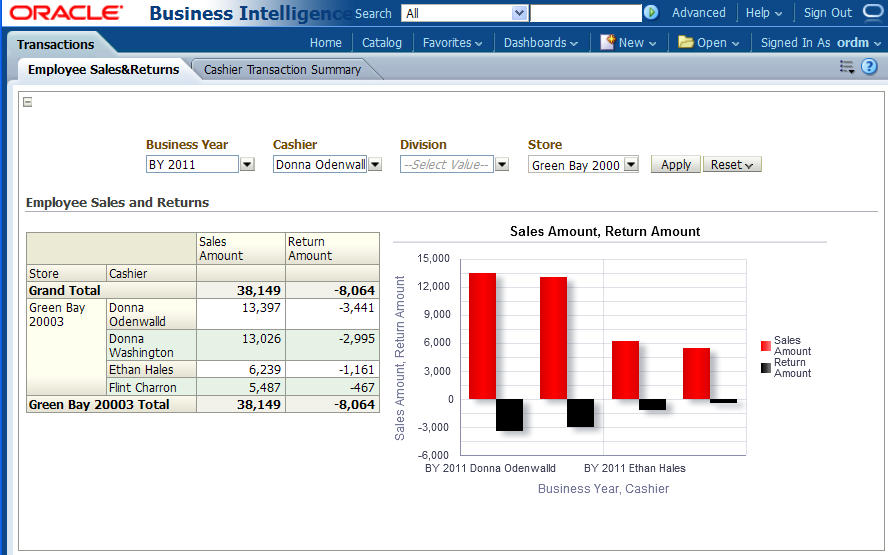
This report, as shown in Figure 13-7 provides sales and return measures by location and employee.
Report dimensions are:
Business Time
Organization
Cashier
Figure 13-7 Employee Sales and Returns Report
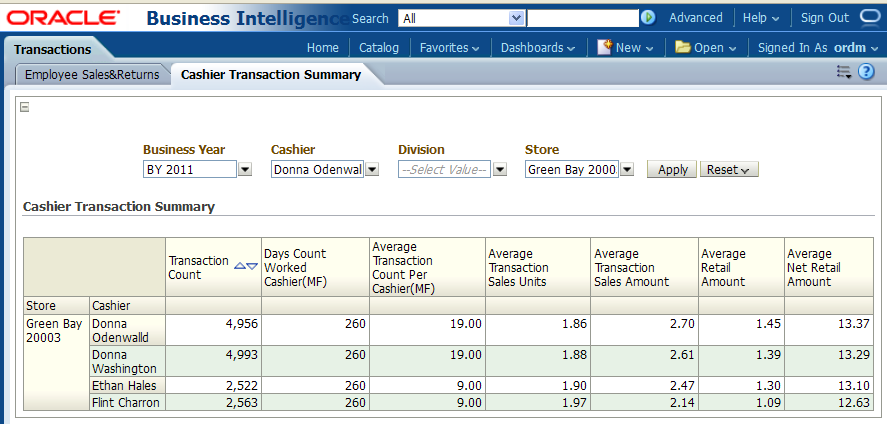
This report, as shown in Figure 13-8 provides cashier productivity information based on sales measures and transaction activity over time. The report is used to identify the most or least productive cashiers.
Report dimensions are:
Business Time
Organization
Cashier
Figure 13-8 Cashier Transaction Summary Report
Employee analysis includes the Employee Basket DT Profile, Employee Basket Factor Rank, Employee Basket Prediction, Employee Sales DT Profile, Employee Sales Factor Rank, Employee Sales Prediction and Employee Combination DT Profile reports.
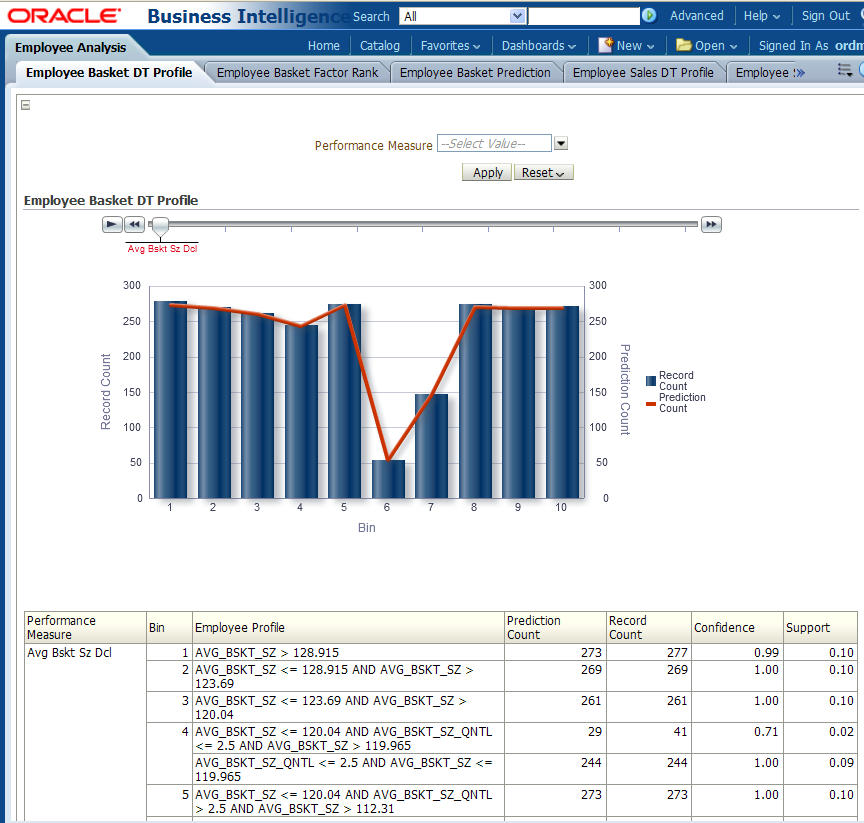
This report, as shown in Figure 13-9 provides Employee Basket Analysis with DT rules.
Report dimensions are:
Business Time
Organization
Cashier
Figure 13-9 Workforce Employee Basket DT Profile
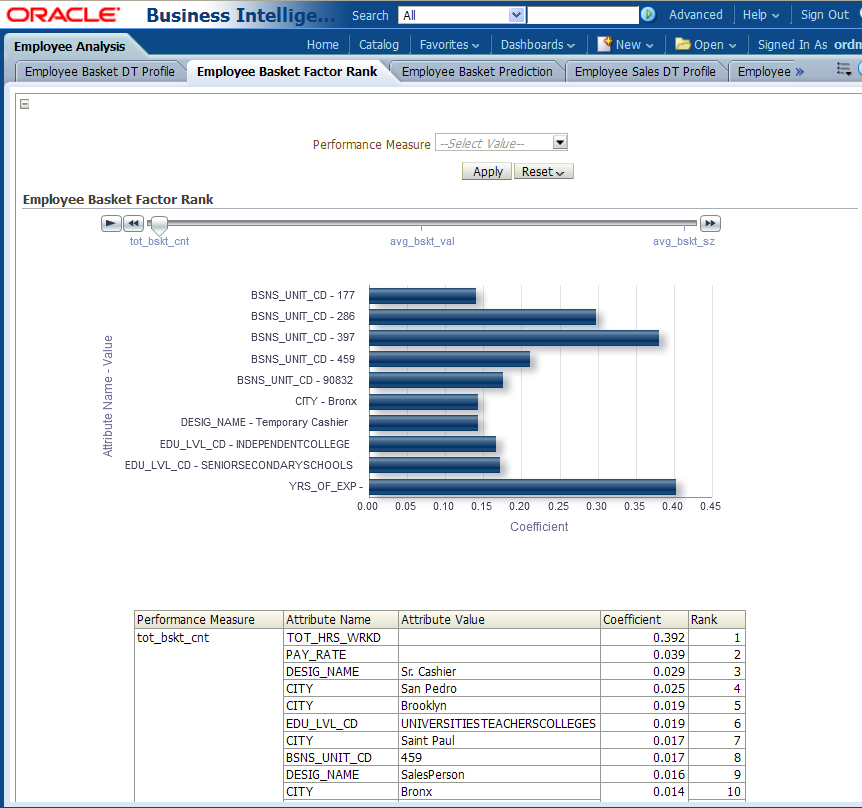
This report, as shown in Figure 13-10 provides Employee Basket Analysis Ranking with SVM Factors.
Report dimensions are:
Business Time
Organization
Cashier
Figure 13-10 Employee Basket Factor Rank Report
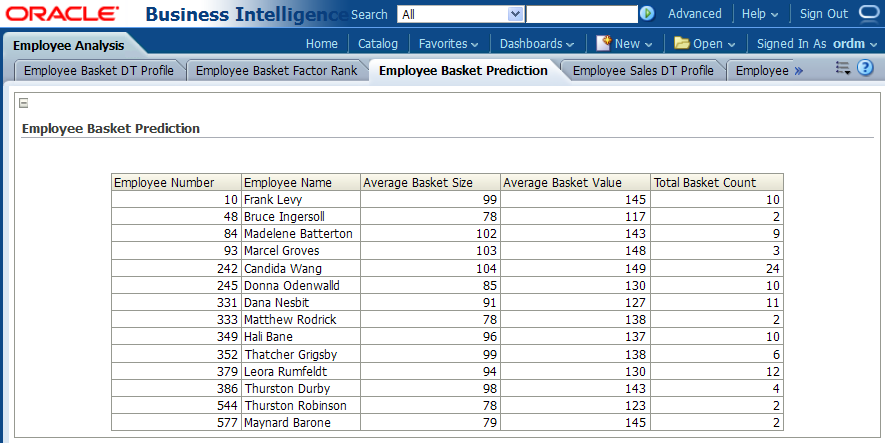
This report, as shown in Figure 13-11 provides employee basket prediction.
Report dimensions are:
Business Time
Organization
Cashier
Figure 13-11 Employee Basket Prediction Report
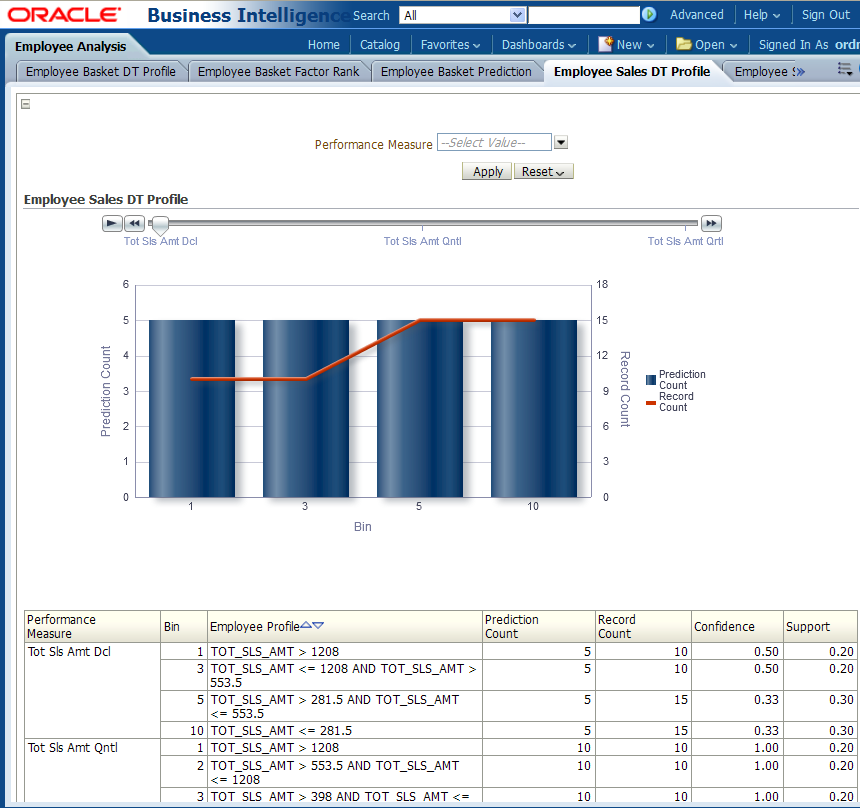
This report, as shown in Figure 13-12 provides Employee Sales Analysis.
Report dimensions are:
Business Time
Organization
Cashier
Figure 13-12 Employee Sales DT Profile Report
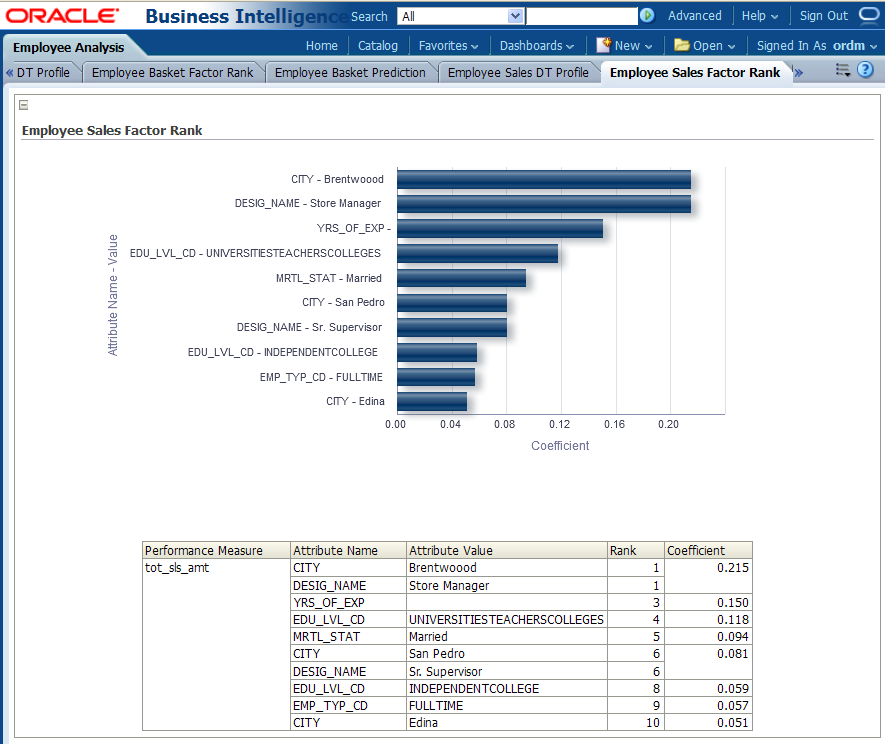
This report, as shown in Figure 13-13 provides Employee Sales ranking.
Report dimensions are:
Business Time
Organization
Cashier
Figure 13-13 Employee Sales Factor Rank Report
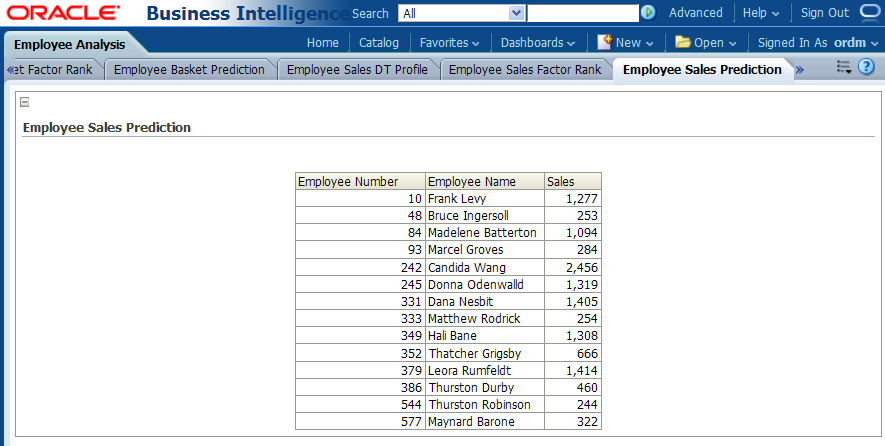
This report, as shown in Figure 13-14 provides Employee Sales perdition.
Report dimensions are:
Business Time
Organization
Cashier
Figure 13-14 Employee Sales Prediction Report
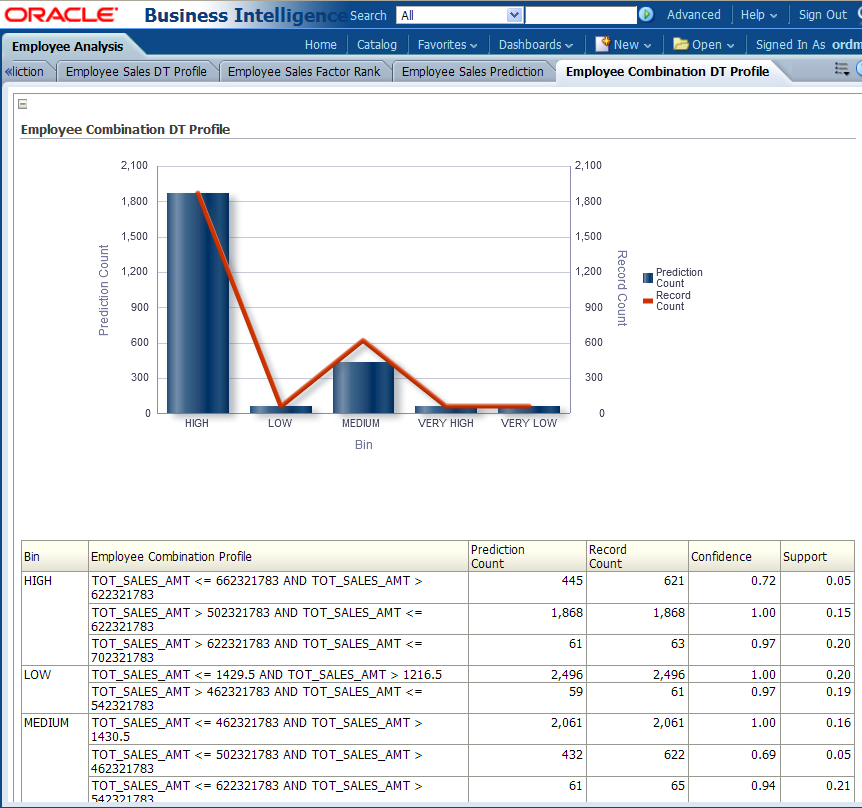
This report, as shown in Figure 13-15 provides Employee Sales to identify combination of employees which is likely to perform better at a store on a shift.
Report dimensions are:
Business Time
Organization
Cashier
Figure 13-15 Employee Combination DT Profile
The points of service reports include the following areas:
Conversion includes the Sales Conversion, Sales Comparison, Store Traffic Day and Store Traffic Week reports.
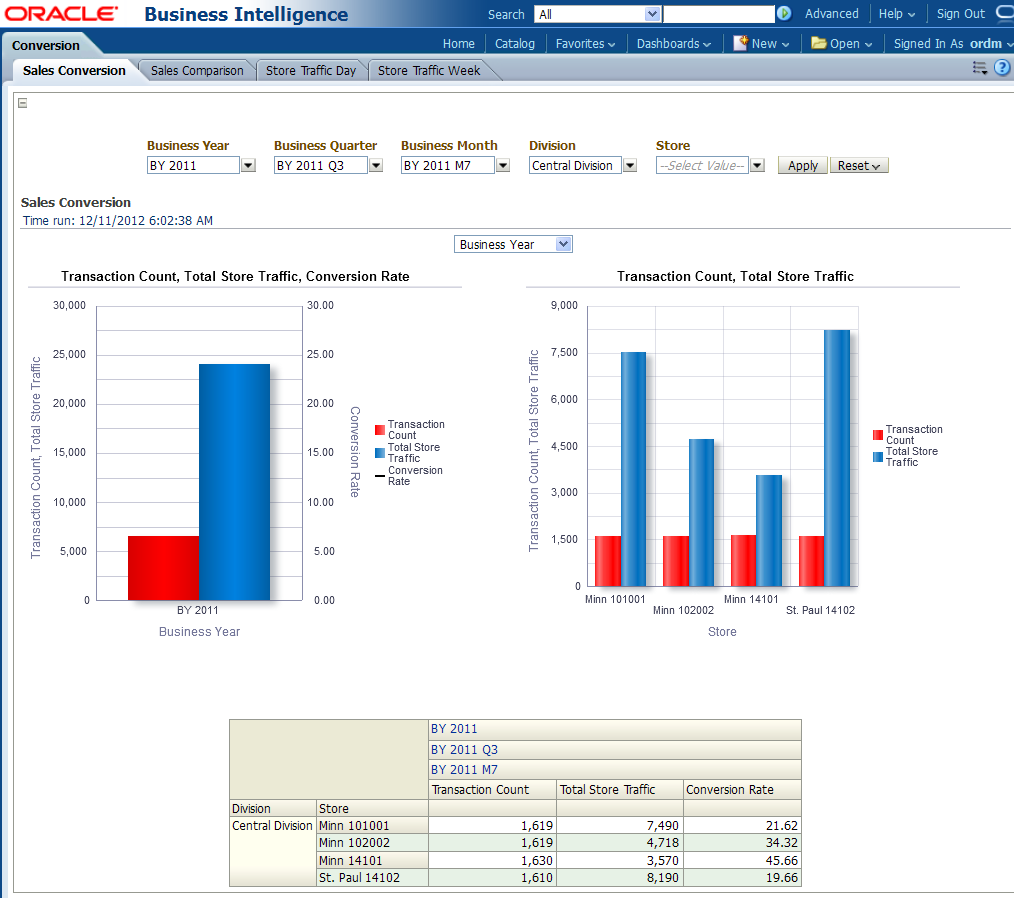
This report, as shown in Figure 13-16 provides the purchase rate per visit for store by year, Quarter, and Month.
Report dimensions are:
Business Time
Organization
Figure 13-16 Point of Sale Sales Conversion
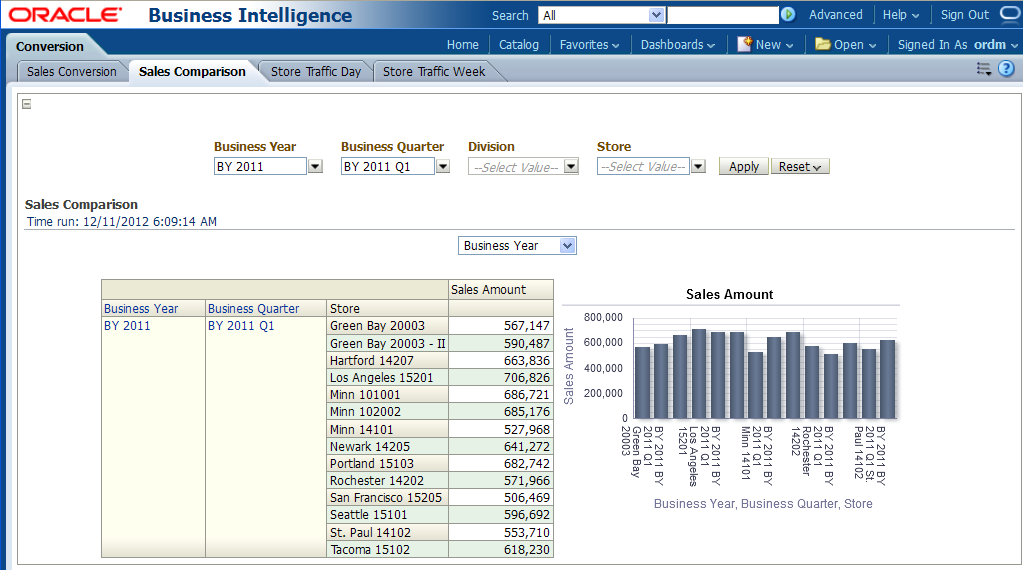
This report, as shown in Figure 13-17 provides the yearly or quarterly moving of sales for various stores.
Report dimensions are:
Business Time
Organization
Figure 13-17 Point of Service Sales Comparison
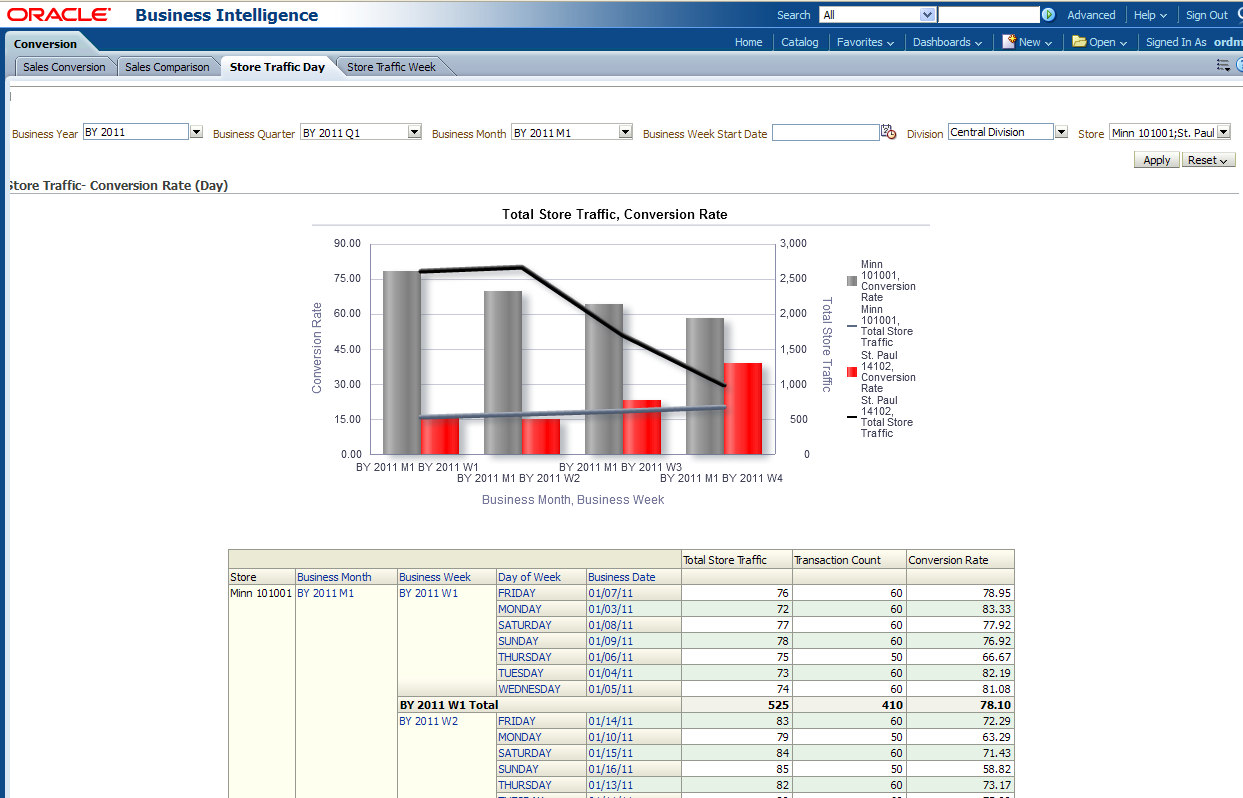
This report, as shown in Figure 13-18 provides the Daily transaction activity based on store traffic measure for one or more division.
Report dimensions are:
Business Time
Organization
Figure 13-18 Point of Sale Store Traffic Day
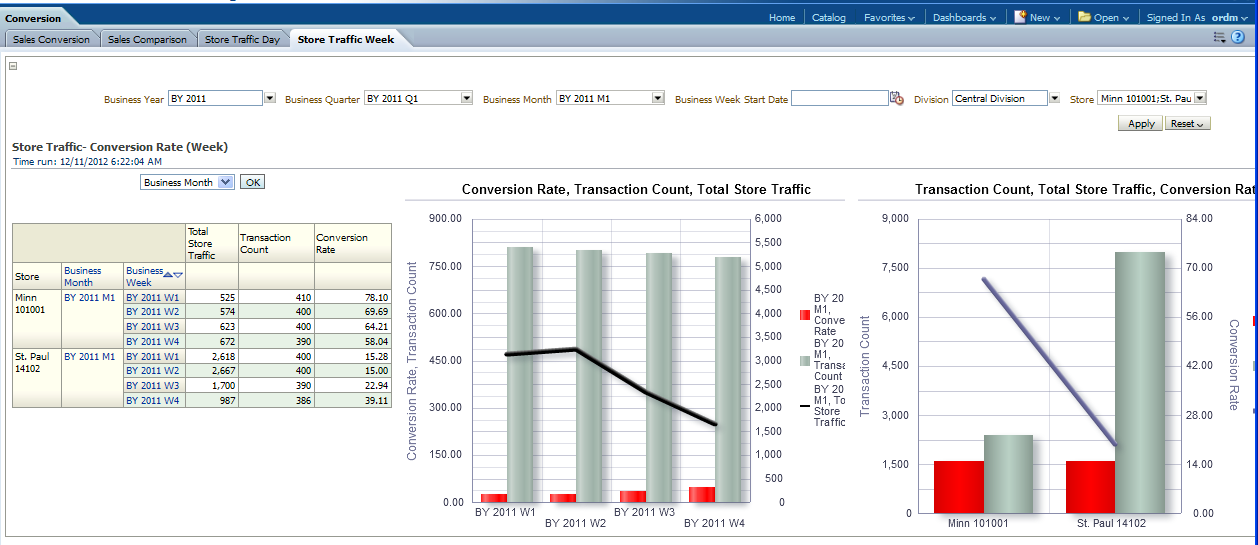
This report, as shown in Figure 13-19 provides the weekly transaction activity based on store traffic measure for one or more division.
Report dimensions are:
Business Time
Organization
Figure 13-19 Store Traffic-Conversion Rate (Week) Report
Entry methods includes the Entry Methods (Column Total), and Entry Methods (Row Total) reports.
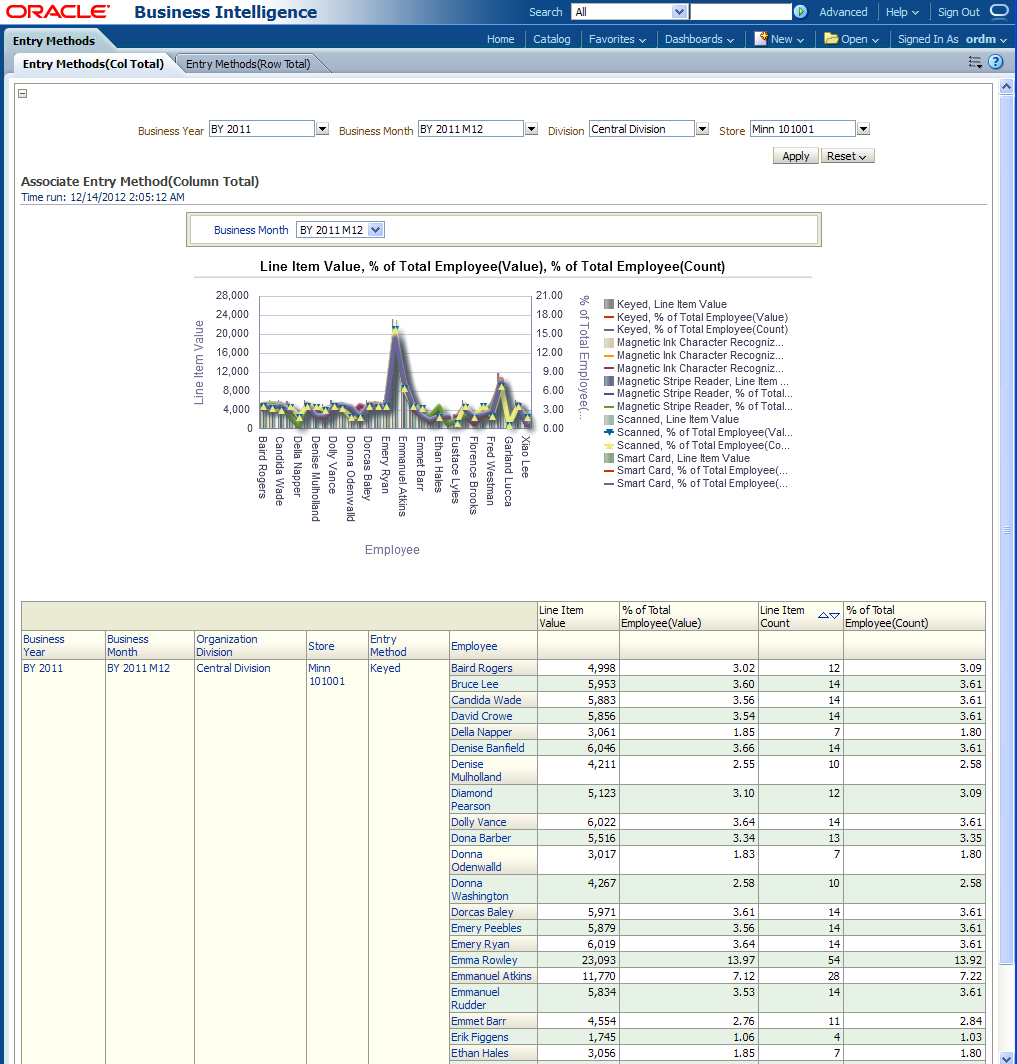
This report, as shown in Figure 13-20 provides the (by employee) entry method analysis at detail level transaction.
Report dimensions are:
Business Time
Organization
Employee
Entry Method
Figure 13-20 Point of Sale Associate Entry Method (Column Total)
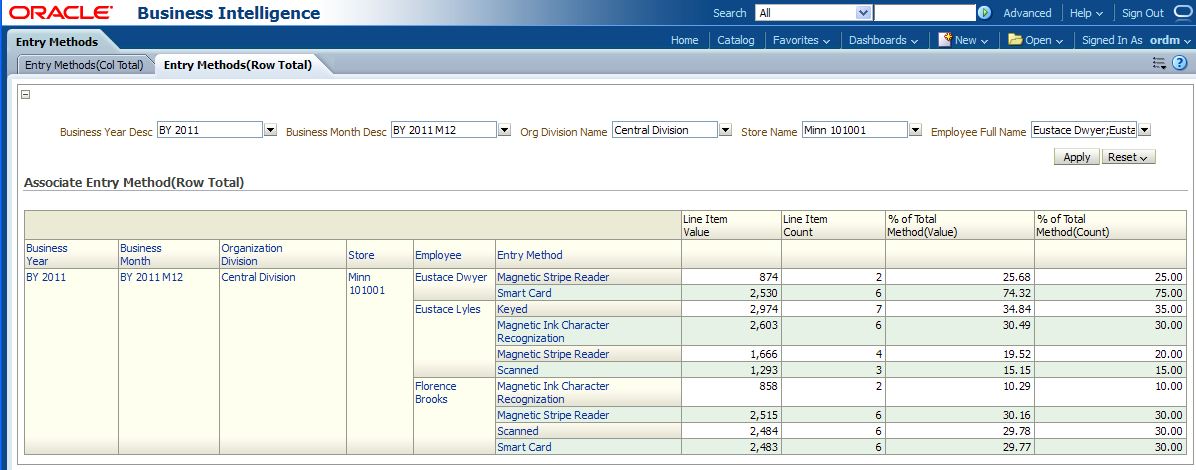
This report, as shown in Figure 13-21 provides the (by employee) entry method analysis at detail level transaction.
Report dimensions are:
Business Time
Organization
Employee
Entry Method
Figure 13-21 Point of Service Associate Entry Method (Row Total) Report
Flow analysis includes the Store Traffic, Sales Trend Transaction Count, Sales Trend, and Transaction Profile reports.
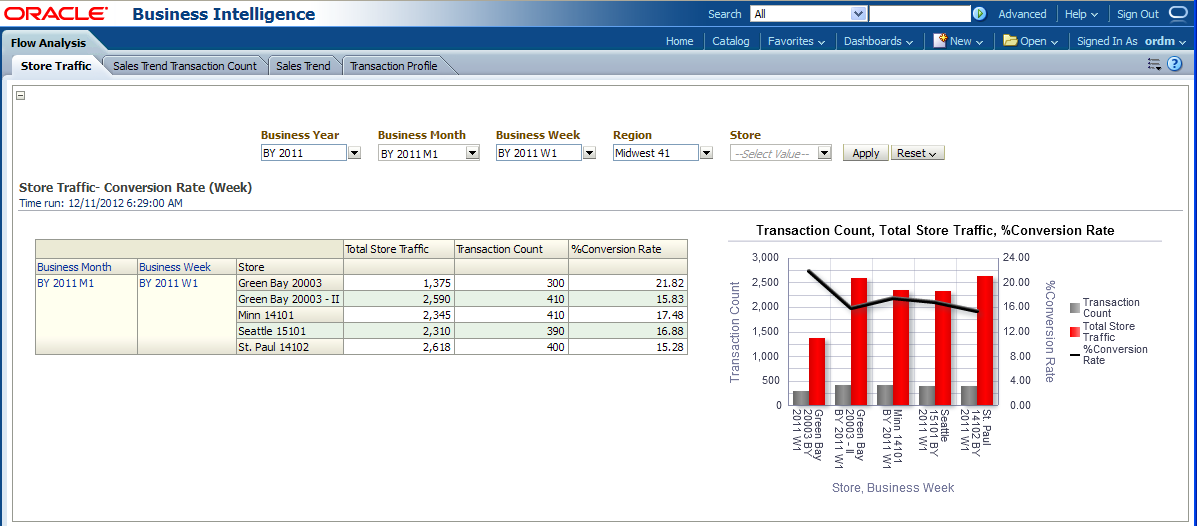
This report, as shown in Figure 13-22 provides the weekly transaction activity information based on store traffic measure for one or more stores.
Report dimensions are:
Business Time
Organization
Figure 13-22 Point of Service Flow Analysis Store Traffic Report
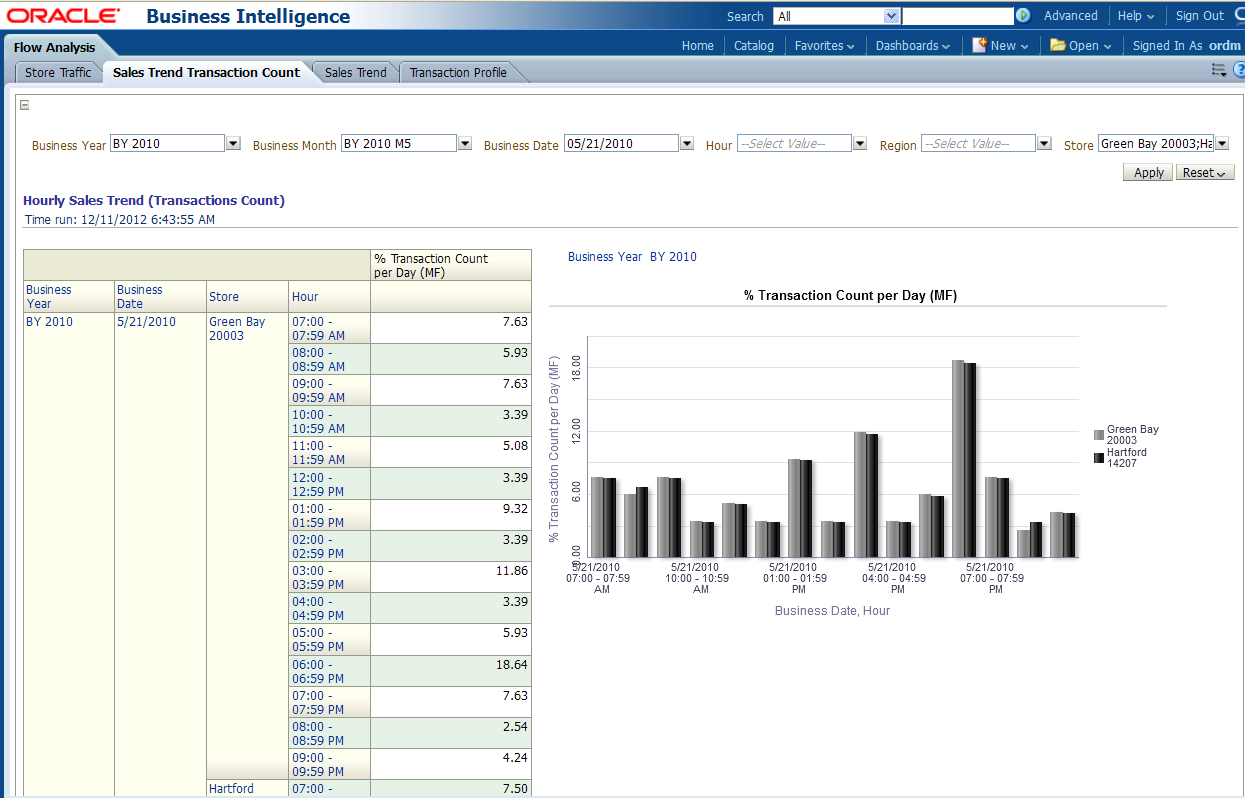
This report, as shown in Figure 13-23 provides the total number of sales transactions processed hourly. The report is used to identify the most or least productivity store.
Report dimensions are:
Business Time
Organization
Figure 13-23 Hourly Sales Trend Transactions Count Report
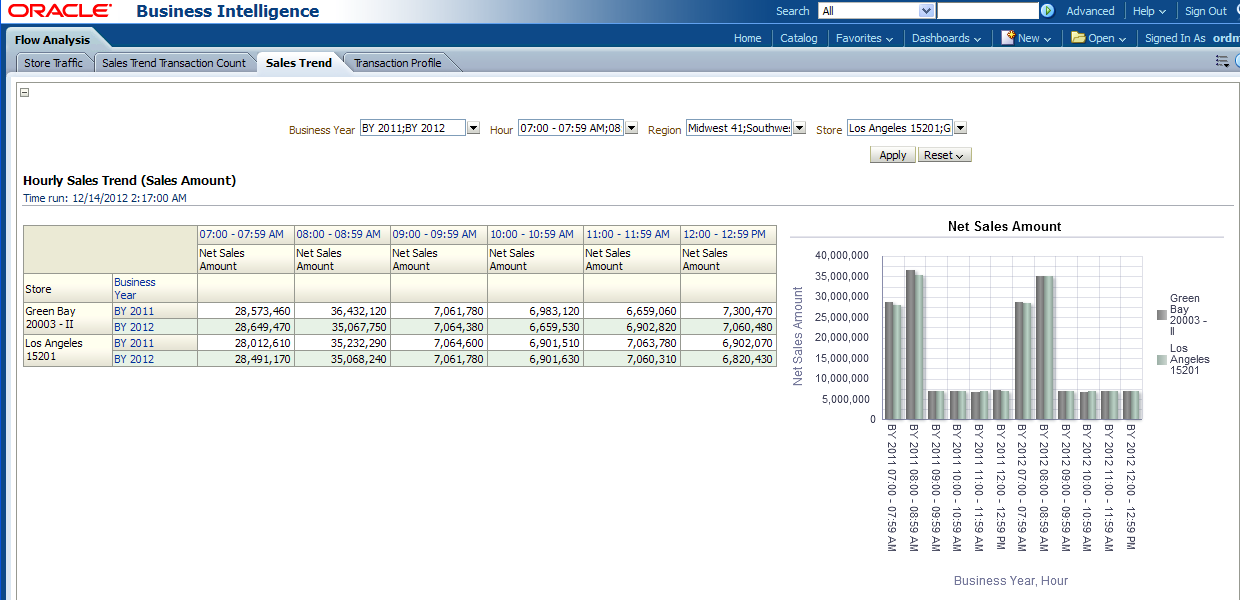
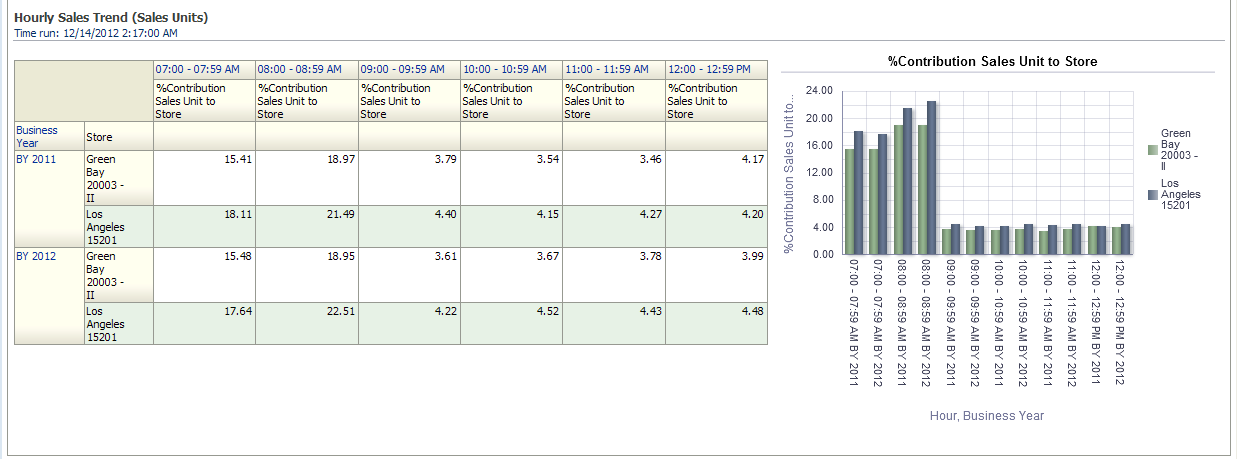
This report, as shown in Figure 13-24 provides the hourly net sales amount and % contribution sales unit based on one or more stores.
Report dimensions are:
Business Time
Organization
Figure 13-24 Hourly Sales Trend (Sales Value and Sales Unit) Report
This report, as shown in Figure 13-25 provides hourly store traffic information based on no of sales transaction activity at a store.
Report dimensions are:
Business Time
Organization
Time of Day
Scorecard area includes the following reports: Sales Productivity, Location Sales Productivity and Selling Location Productivity.
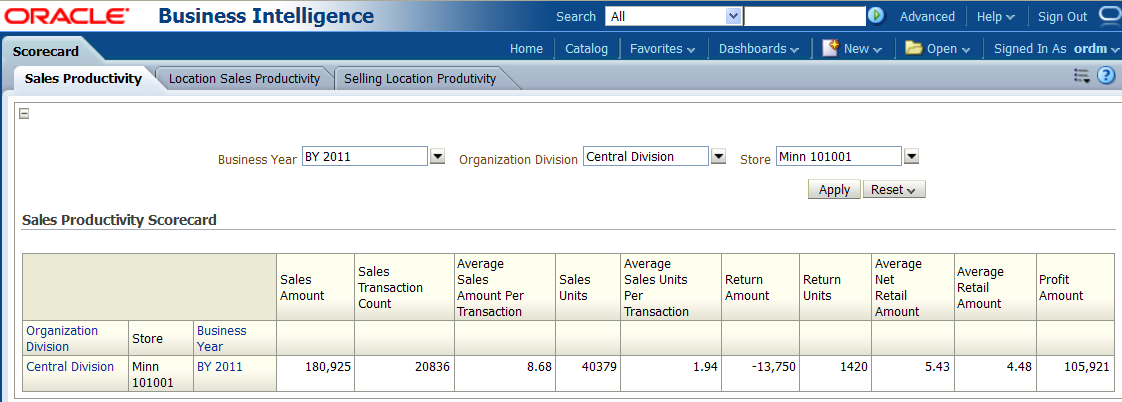
This report, as shown in Figure 13-26 provides the total number of transaction sales units sold hourly, at a location. This report can also identify the most or least productive location.
Report dimensions are:
Business Time
Organization
Figure 13-26 Sales Productivity Scorecard Report
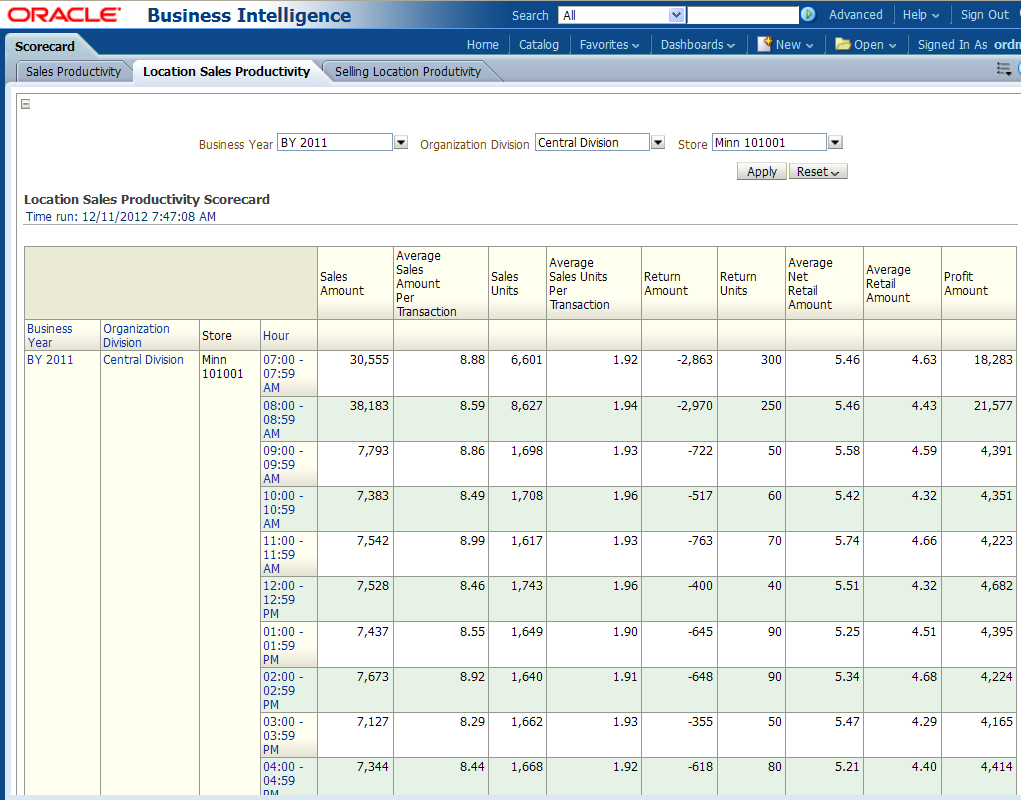
This report, as shown in Figure 13-27 provides by store, hourly sales details based on sales measures.
Report dimensions are:
Business Time
Organization
Time of Day
Figure 13-27 Location Sales Productivity Scorecard Report
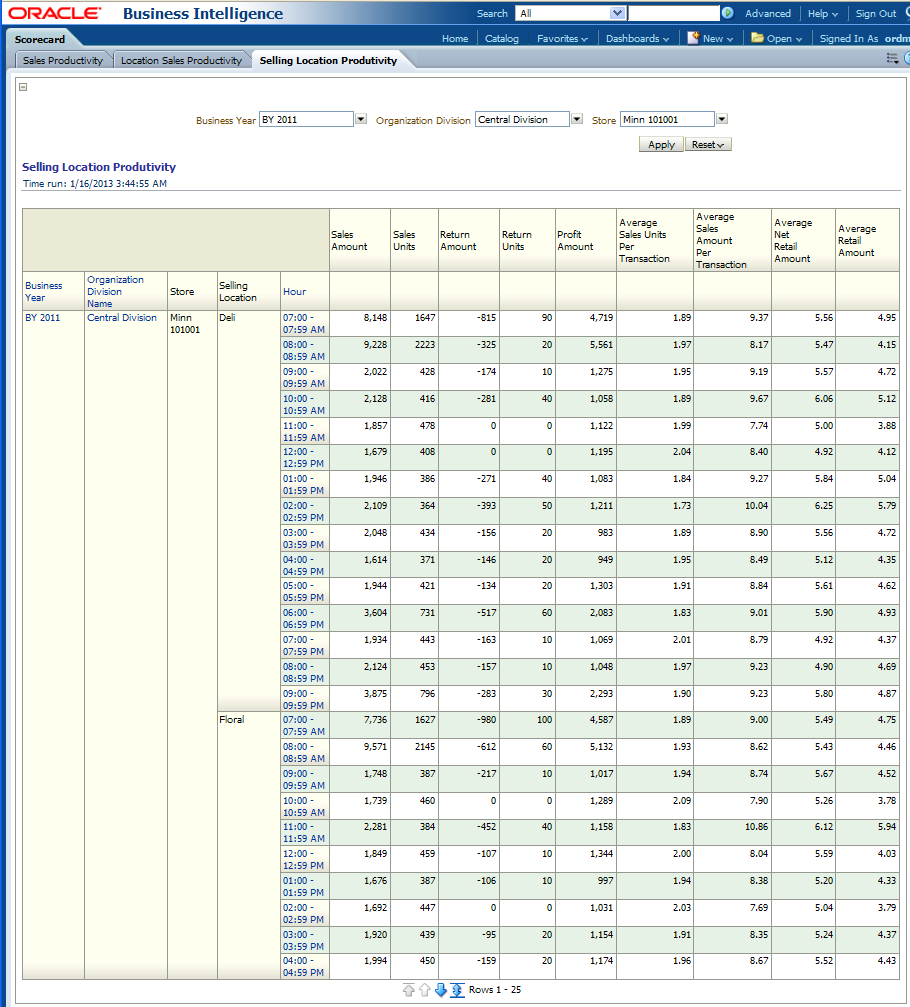
This report, as shown in Figure 13-28 provides business unit productivity information based on sales measures for one or more locations by register and hours.
Report dimensions are:
Business Time
Organization
Time of Day
Figure 13-28 Selling Location Productivity Report
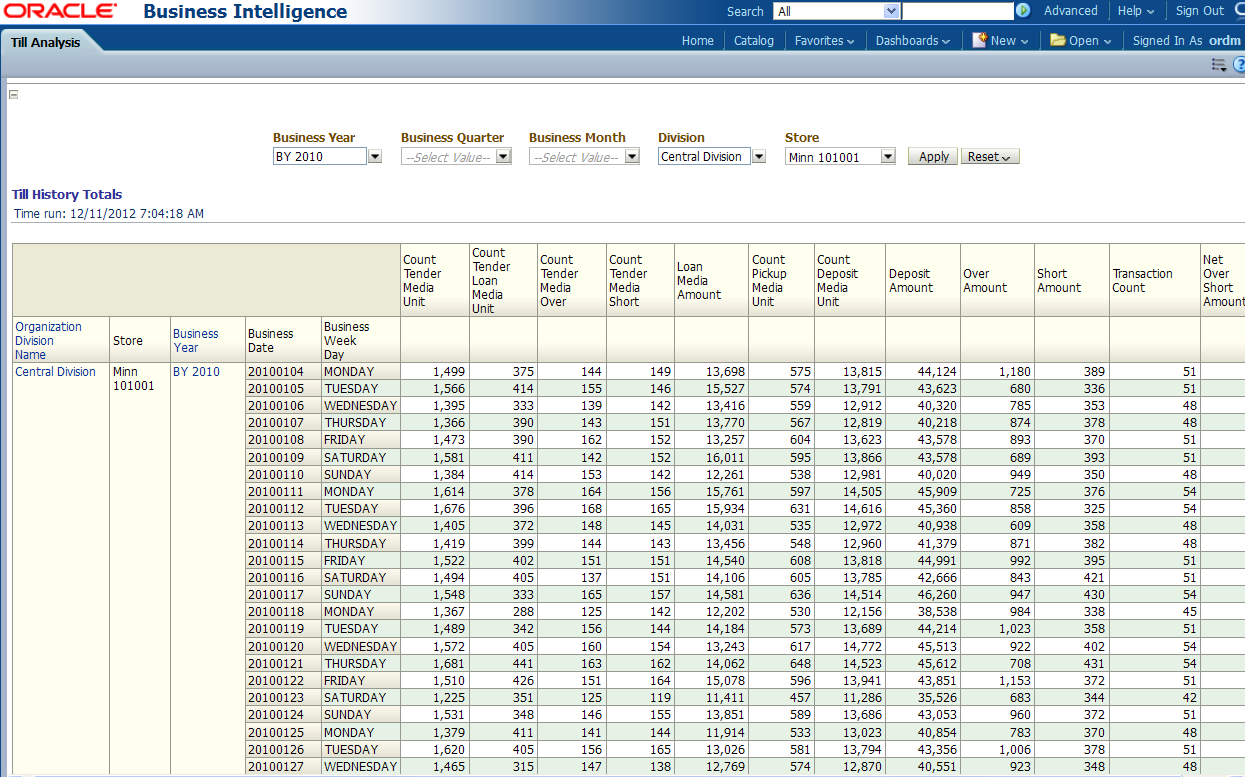
This report, as shown in Figure 13-29 provides various sales audit total values by store, day and week.
Report dimensions are:
Business Time
Organization
Till Tender
Transactions area includes the following reports: Transaction by Associates, Transaction Profile, Store and Transaction Types, and Loss Prevention Transactions.
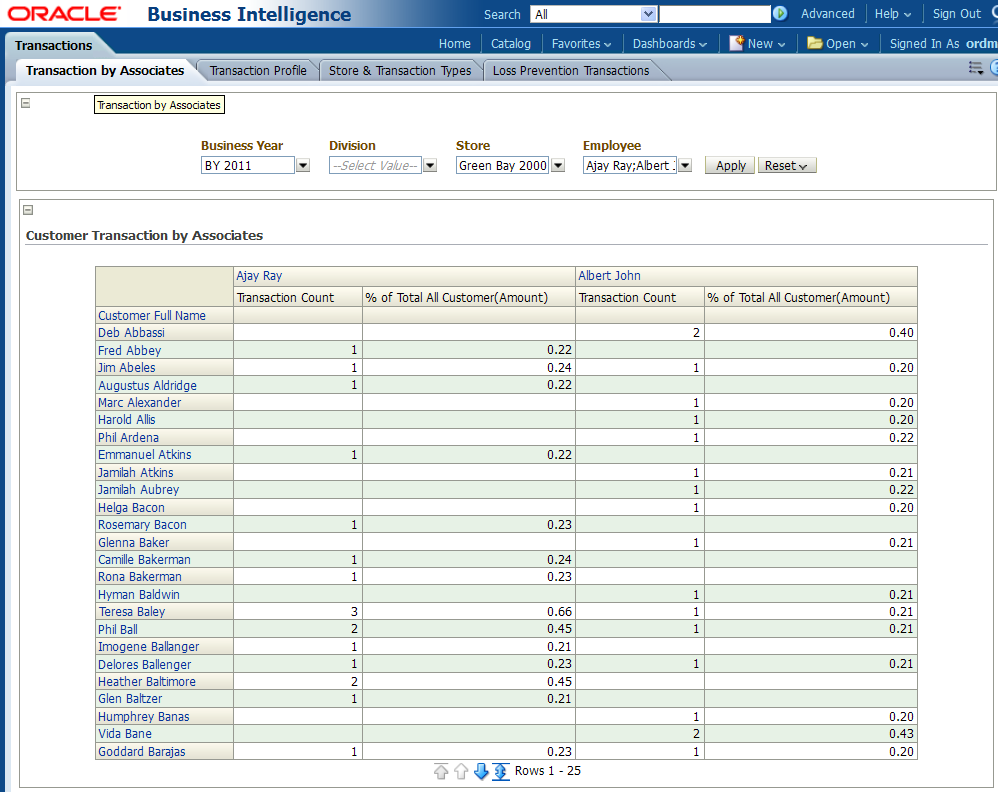
This report, as shown in Figure 13-30 provides the summary of customer transactions and identifying exceptional number of transactions between an associate and customer for a particular store.
Report dimensions are:
Business Time
Organization
Employee
Customer
Figure 13-30 Customer Transactions by Associate Report
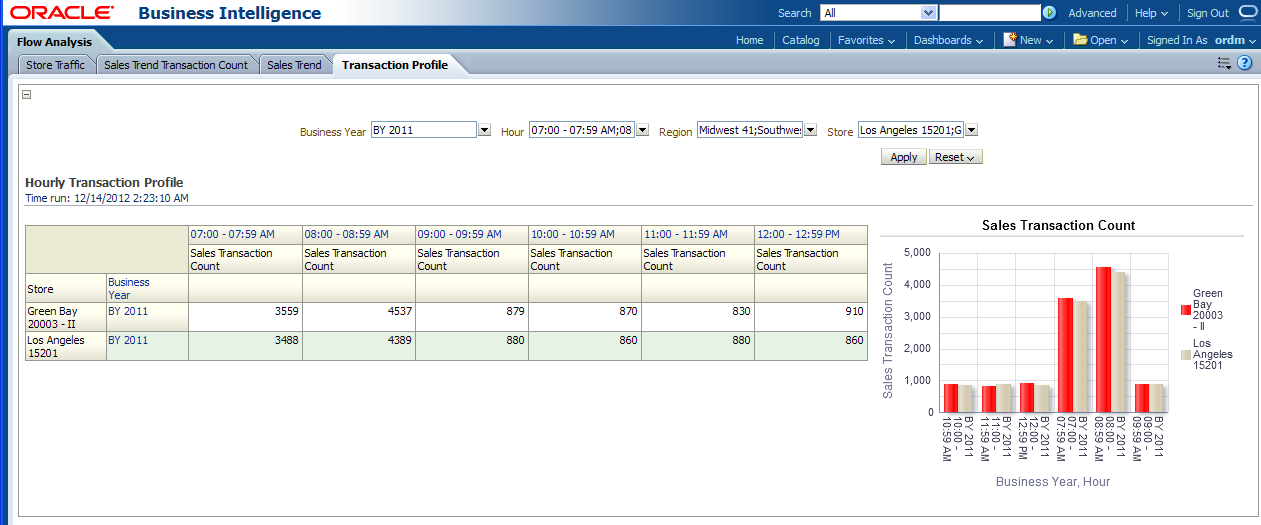
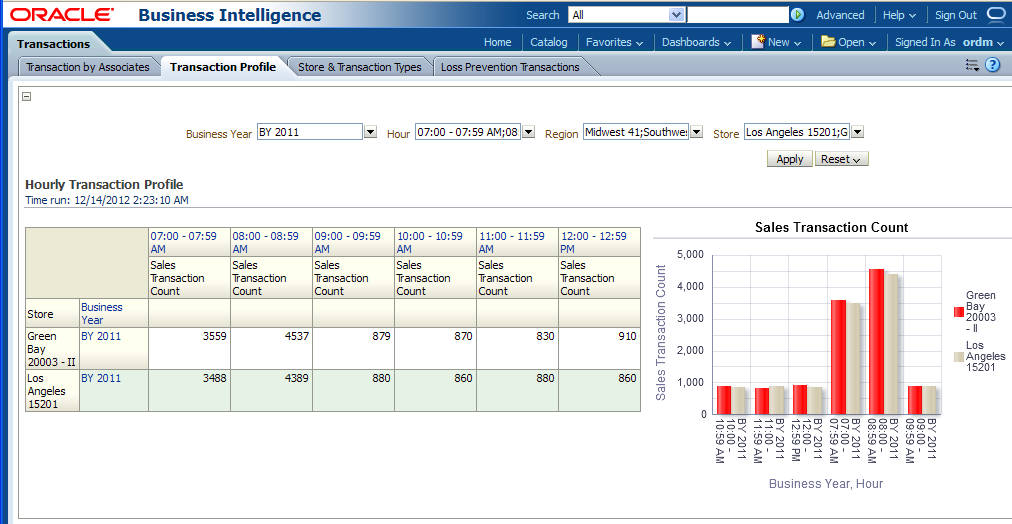
This report, as shown in Figure 13-31 provides hourly store traffic information based on of sales transaction.
Report dimensions are:
Business Time
Organization
Time of Day
Figure 13-31 Hourly Transaction Profile Report
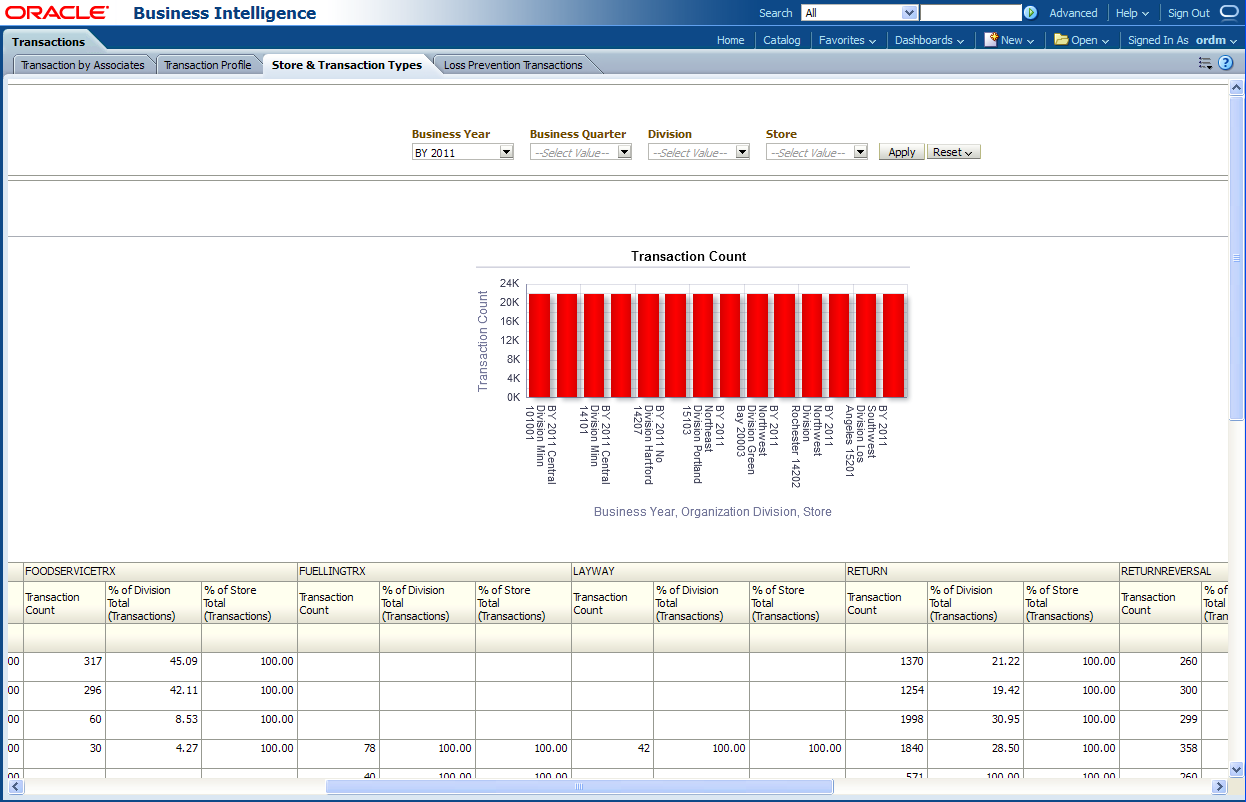
This report, as shown in Figure 13-32 provides (by store) transaction detail on different transaction types.
Report dimensions are:
Business Time
Organization
Figure 13-32 Retail Transaction Type by Store Report
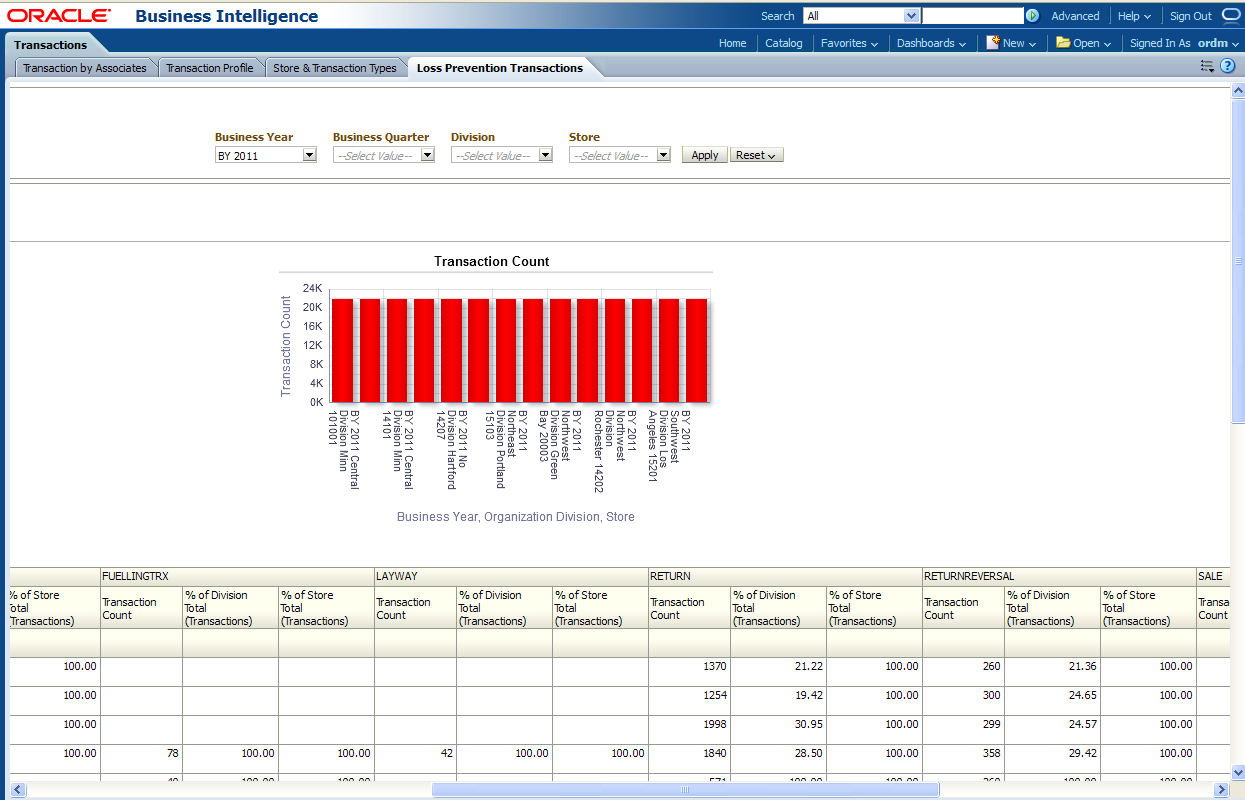
This report, as shown in Figure 13-33 provides the reduction in inventory (due to damage, spoilage and so forth).
Report dimensions are:
Business Time
Organization
Tender Trend
Figure 13-33 Loss Prevention Transactions Report
The Loss Prevention reports include the following areas:
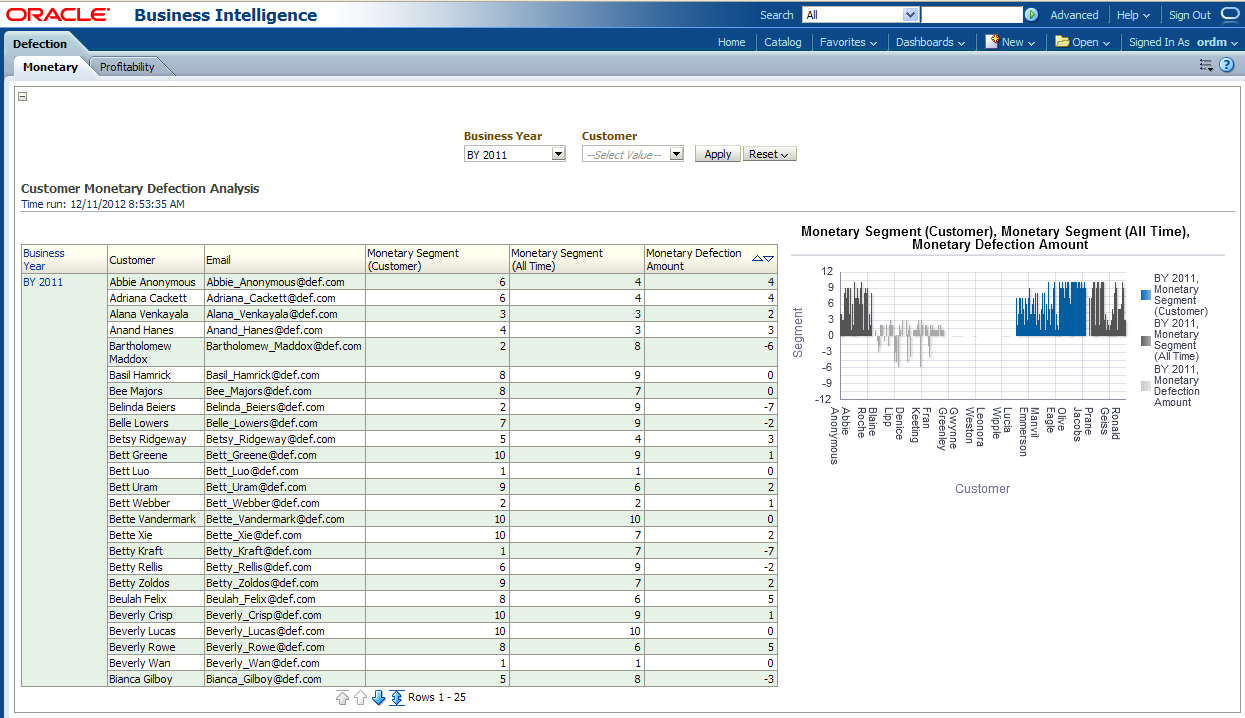
Defection area includes the following reports: Monetary and Profitability.
This report, as shown in Figure 13-34 provides the year level "Customer Monetary Defection Analysis" information for each customer.
Report dimensions are:
Business Time
Customer
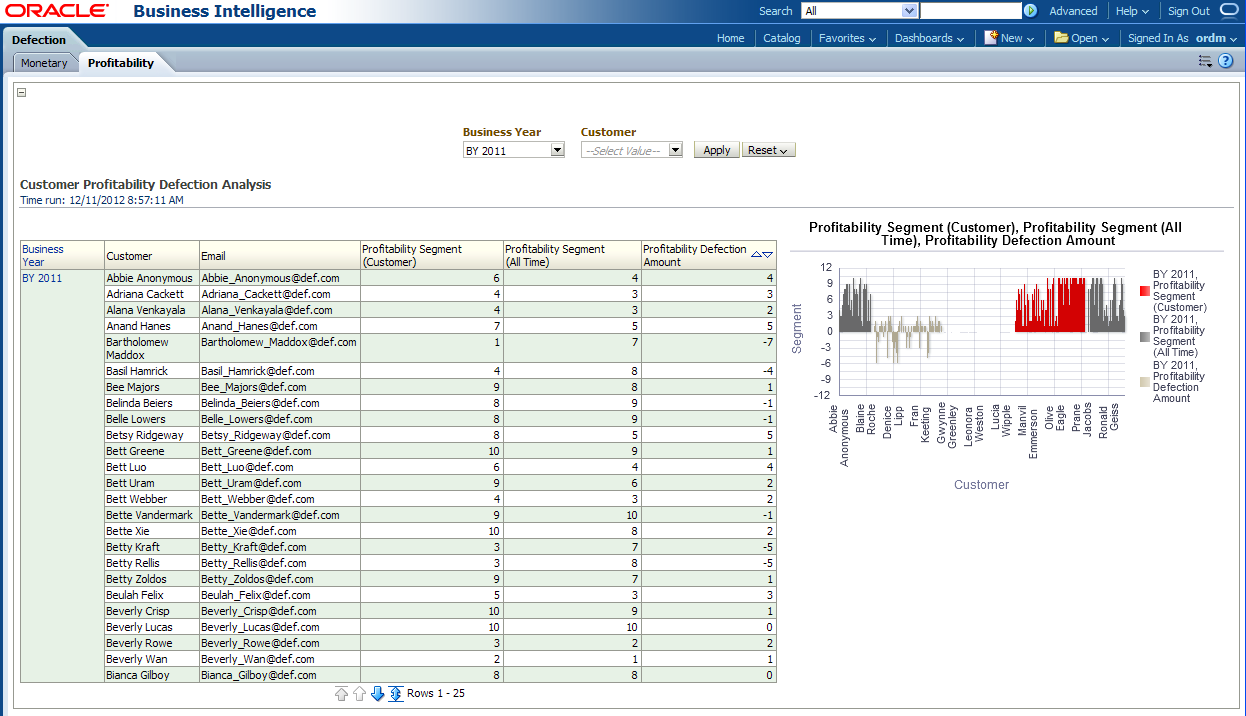
This report, as shown in Figure 13-35 provides the year level "Customer Profitability Defection Analysis" information for each customer.
Report dimensions are:
Business Time
Customer
Figure 13-35 Defection Profitability Report
Shrink and Theft area includes the following reports: Category Trending, and Transaction by Tender.
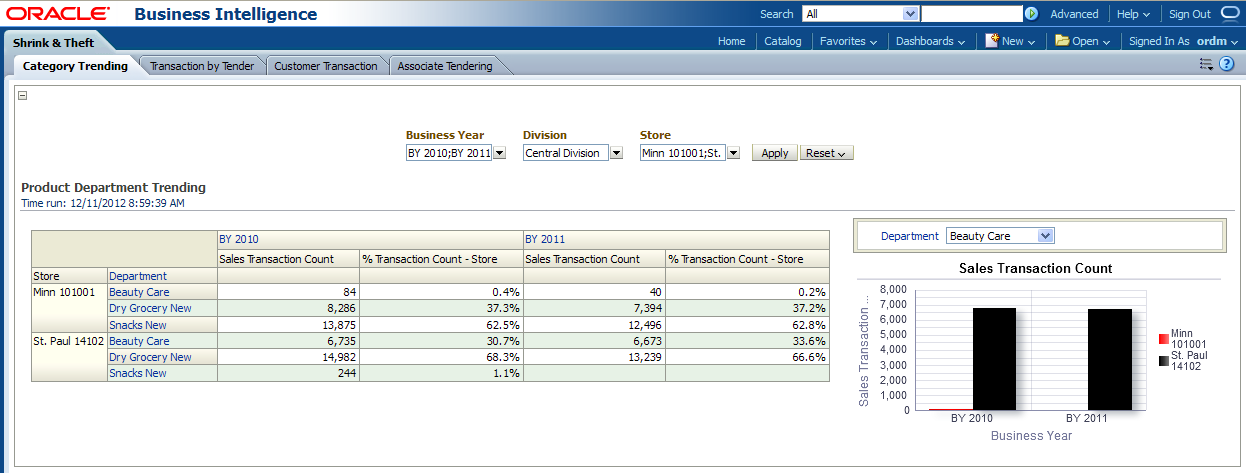
This report, as shown in Figure 13-36 provides product department trending information.
Report dimensions are:
Business Time
Organization
Product
Figure 13-36 Category Trending Shrink and Theft Report
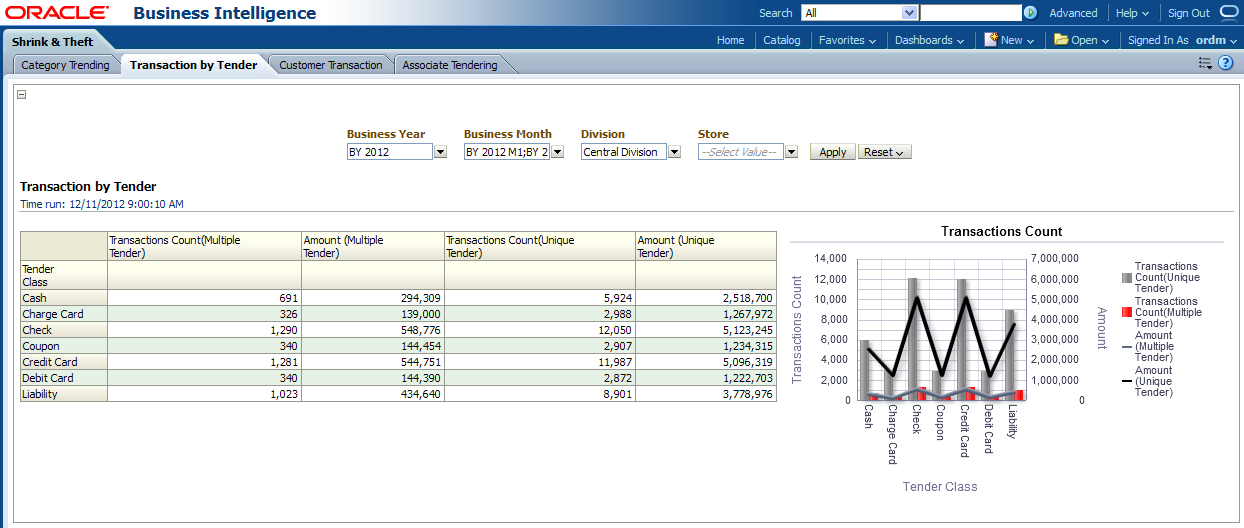
This report, as shown in Figure 13-37 provides the month level "Transaction" information for each organization division, store and tender.
Report dimensions are:
Business Time
Organization
Tender
Figure 13-37 Transaction by Tender Report
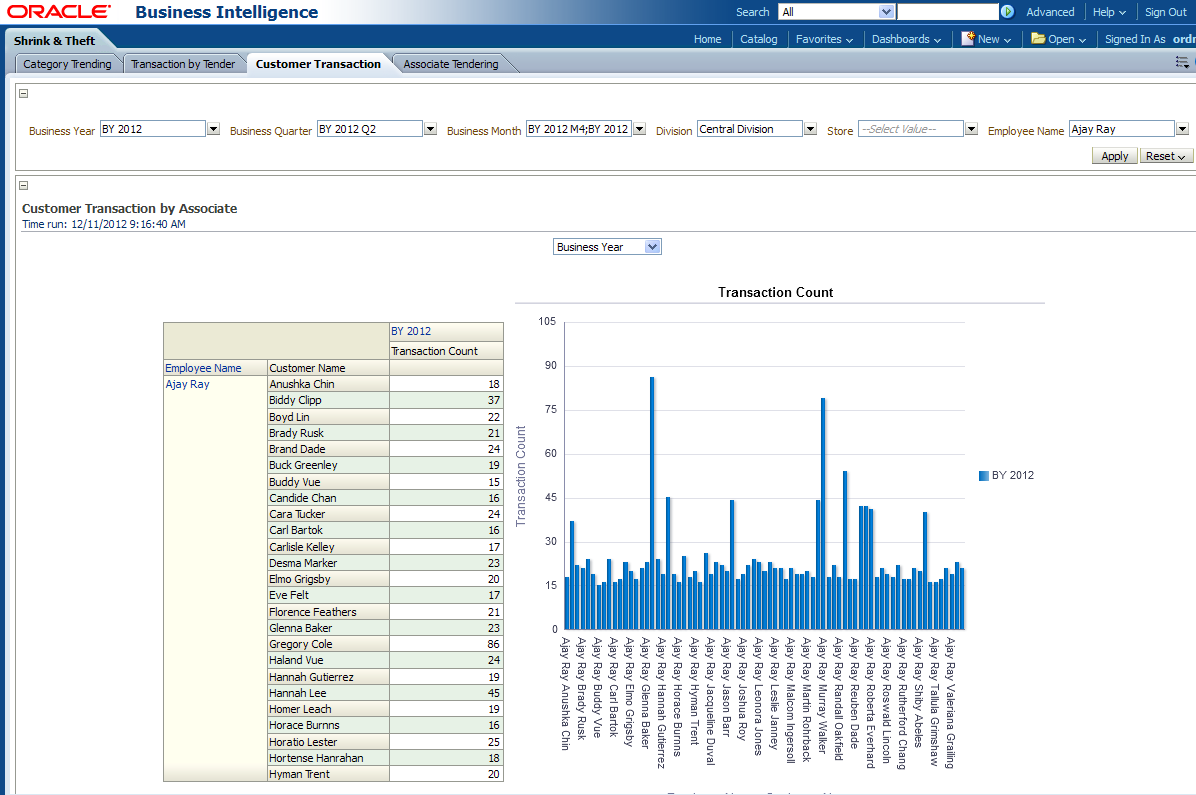
This report, as shown in Figure 13-38 provides the summary of customer transaction and identifying exceptional numbers of transactions between an associate and customer for a particular store.
Report dimensions are:
Business Time
Organization
Employee
Customer
Figure 13-38 Customer Transactions by Associate Report
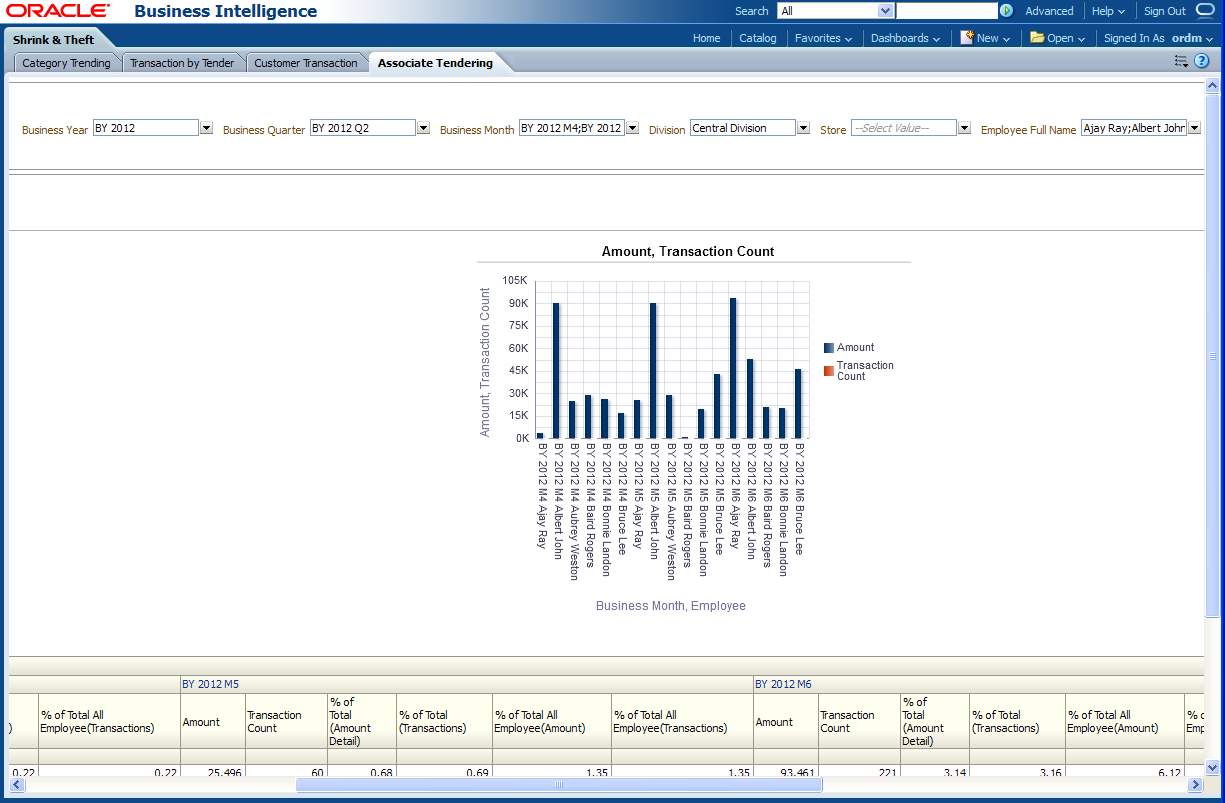
This report, as shown in Figure 13-39 provides the quarter level "Associate Tendering" information for each organization division, store and employee.
Report dimensions are:
Business Time
Organization
Employee
Statistical Outliers area includes the following reports: Statistical Emp Outlier and Statistical Store Outlier.
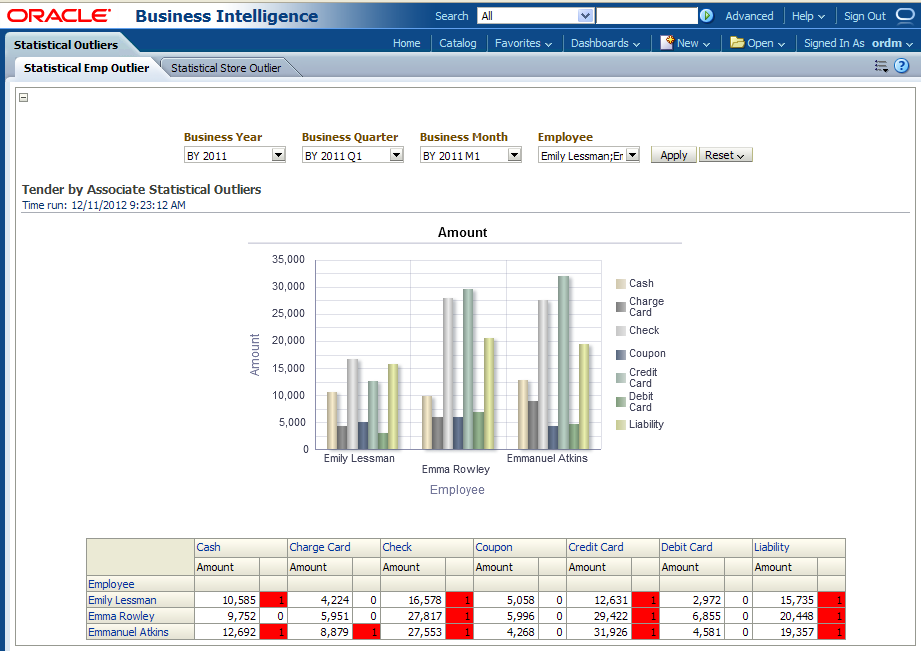
This report, as shown in Figure 13-40 provides the month and quarter level "Associate Statistical Outlier" information for each organization store, employee, and tender.
Report dimensions are:
Business Time
Organization
Tender
Employee
Figure 13-40 Statistical Emp Outlier Report
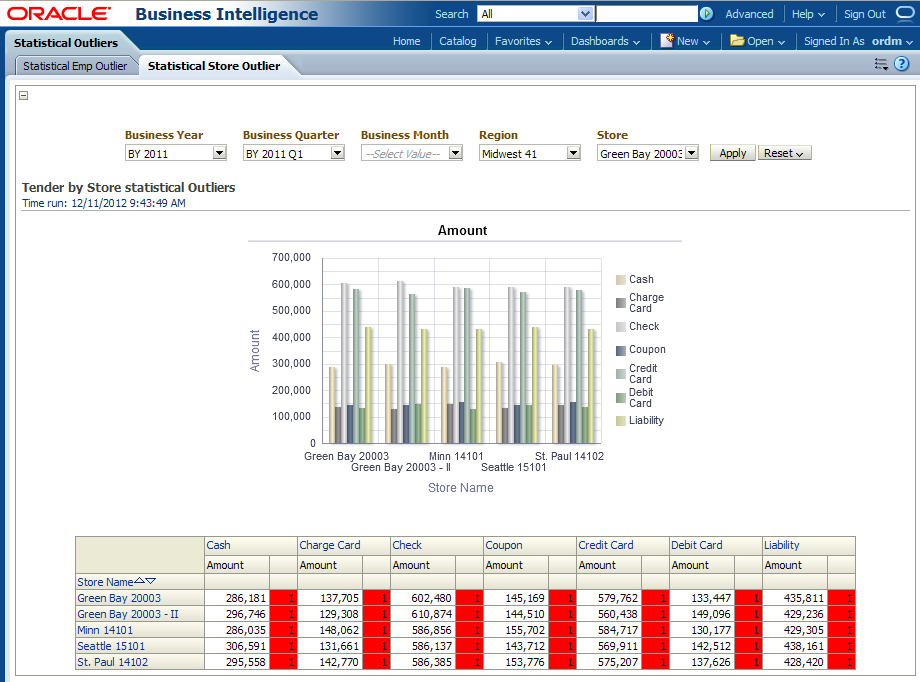
This report, as shown in Figure 13-41 provides the "Statistical Outlier" information for each organization, store, and tender.
Report dimensions are:
Organization
Tender
Figure 13-41 Statistical Store Outlier Report
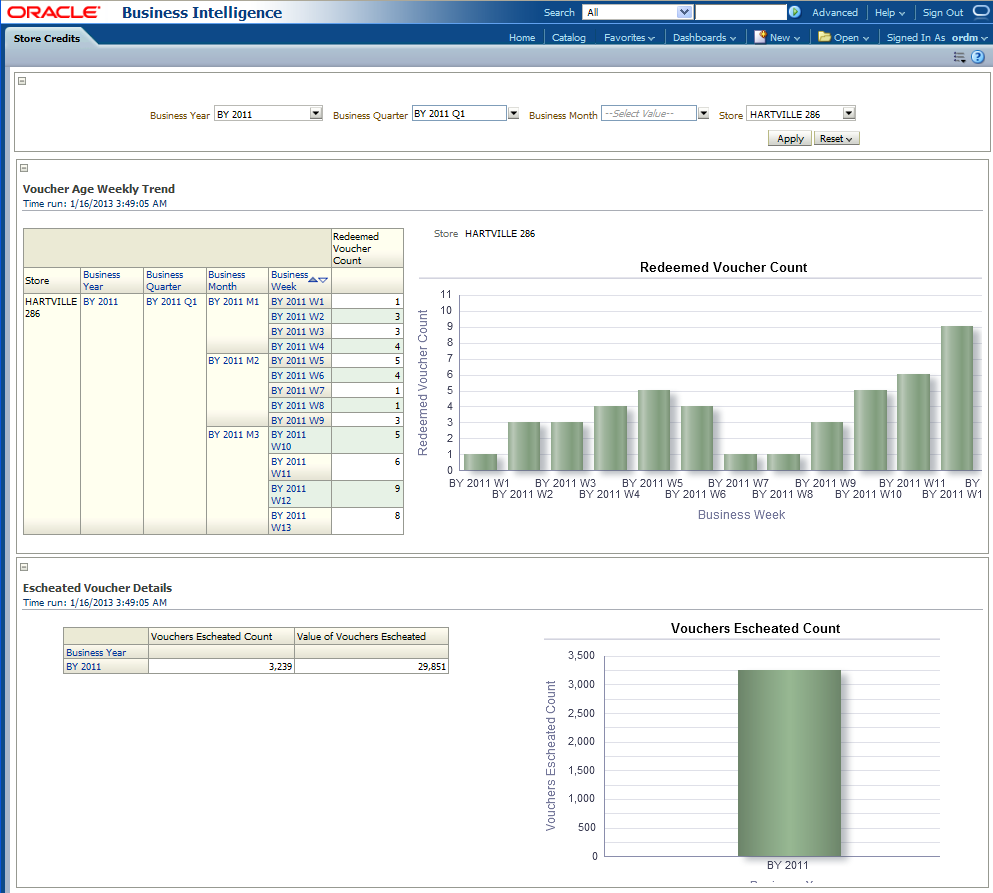
Store Credits area includes the following report: Store Credits.
This report, as shown in Figure 13-42 provides the yearly, monthly, quarterly and weekly "Store Credit" information.
The Inventory reports include the following areas:
Accounting area includes the following reports: Stock Ledger Gross Margin, Adjustments Summary, Inventory Adjustment (Detail), and Availability Analysis.
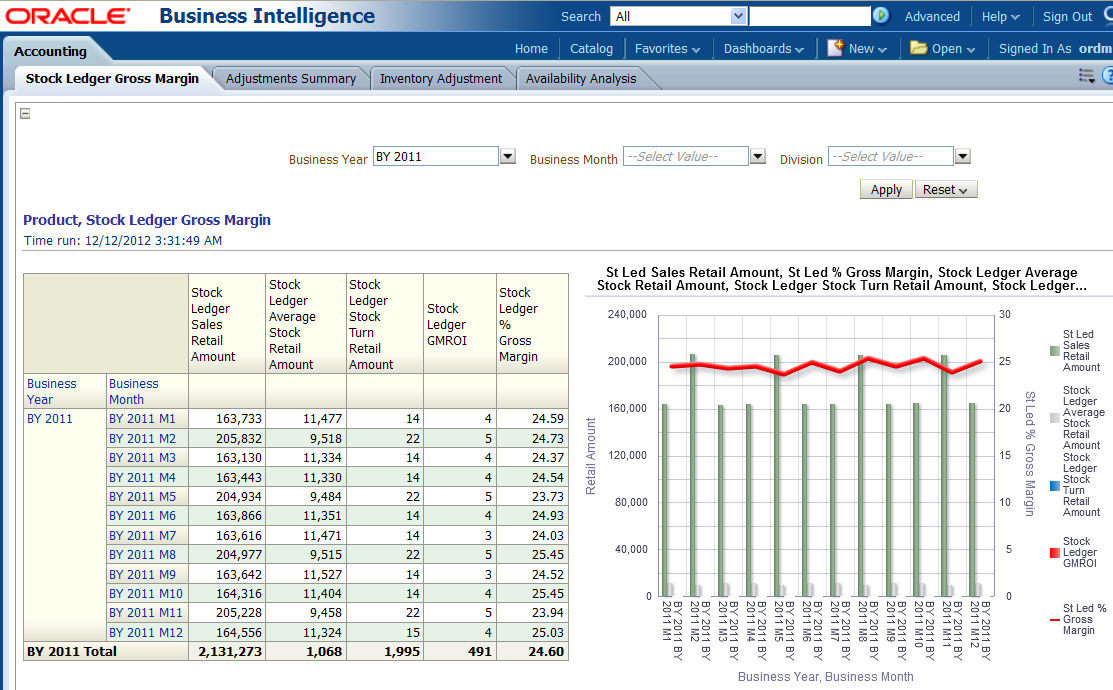
This report, as shown in Figure 13-43 provides the product and stock ledger gross margin report.
Report dimensions are:
Business Time
Organization
Figure 13-43 Stock Ledger Gross Margin Report
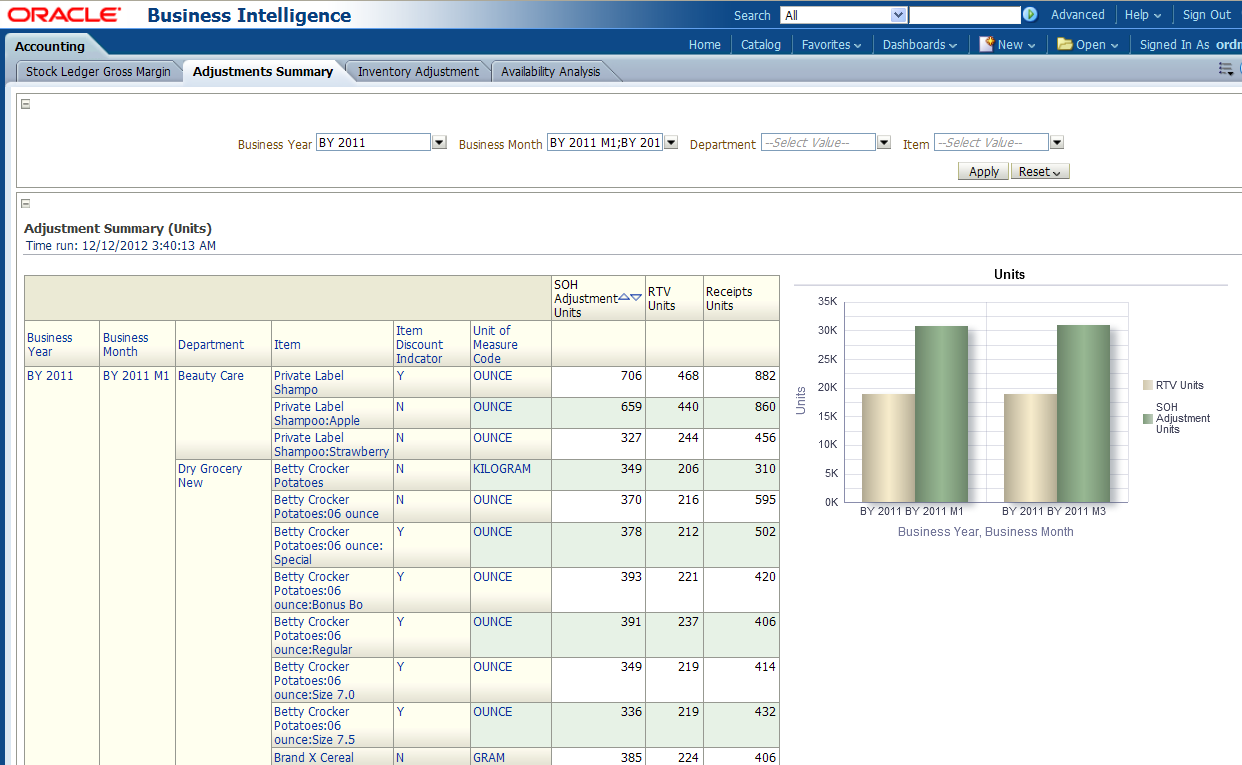
This report, as shown in Figure 13-44 provides yearly, monthly "Adjustment Summary" information for each item department and item.
Report dimensions are:
Business Time
Product
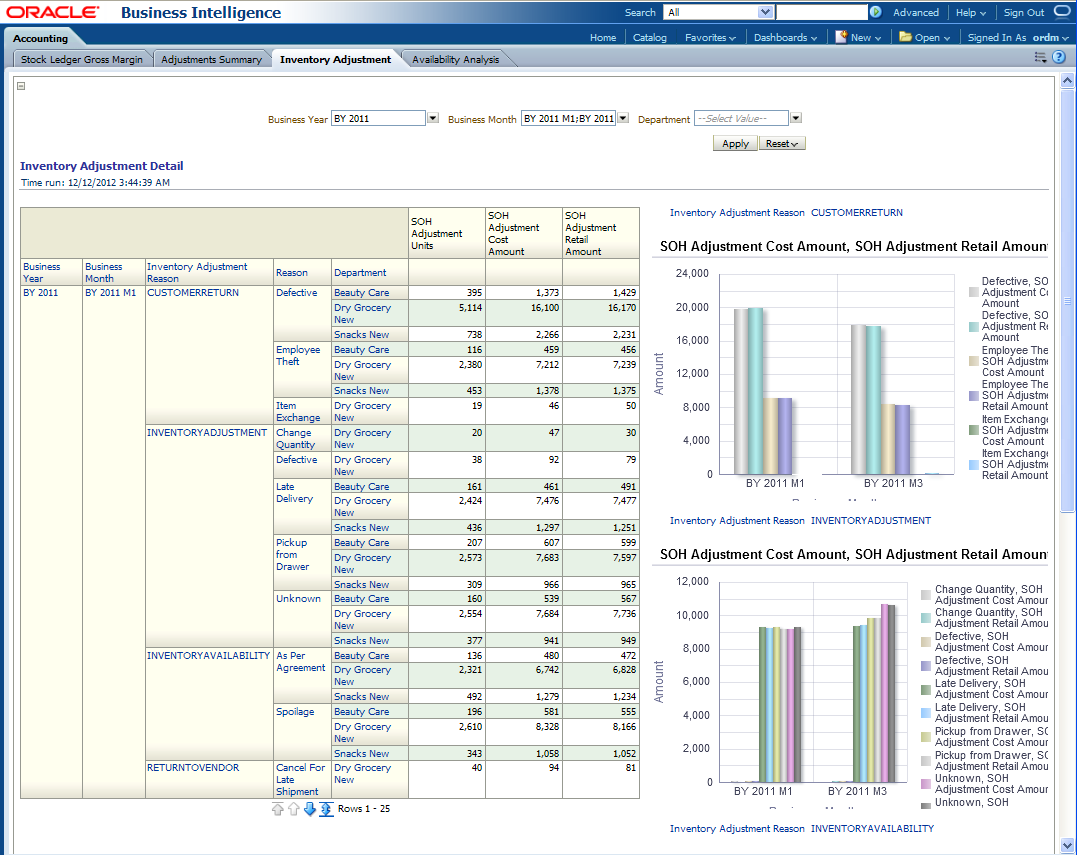
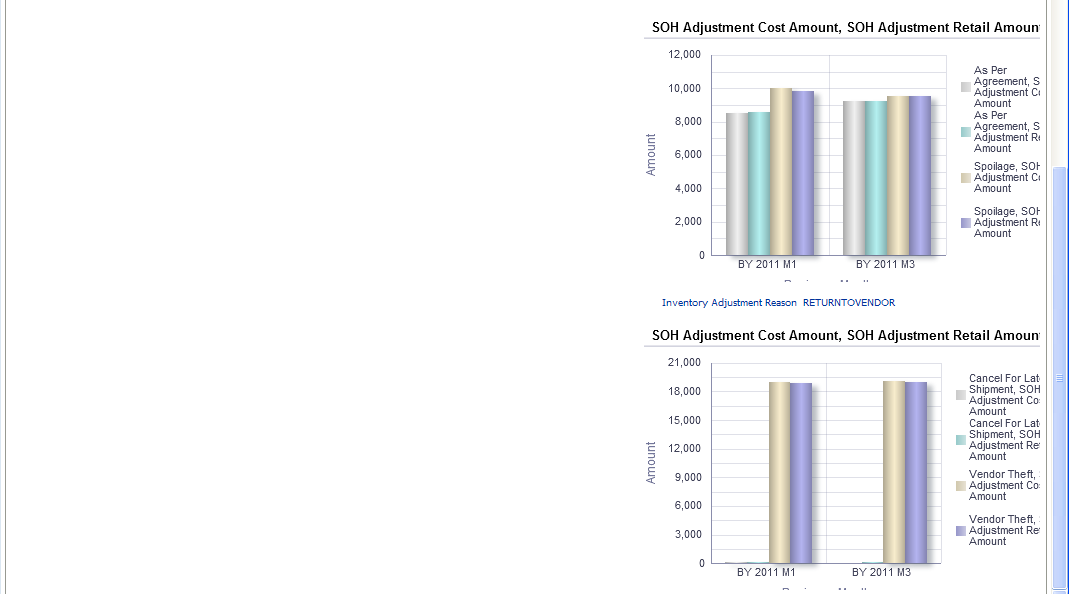
This report, as shown in Figure 13-45 provides yearly, monthly "Inventory Adjustment Details" for each department with reasons.
Report dimensions are:
Business Time
Product
Reason
Figure 13-45 Inventory Adjustment Details Report
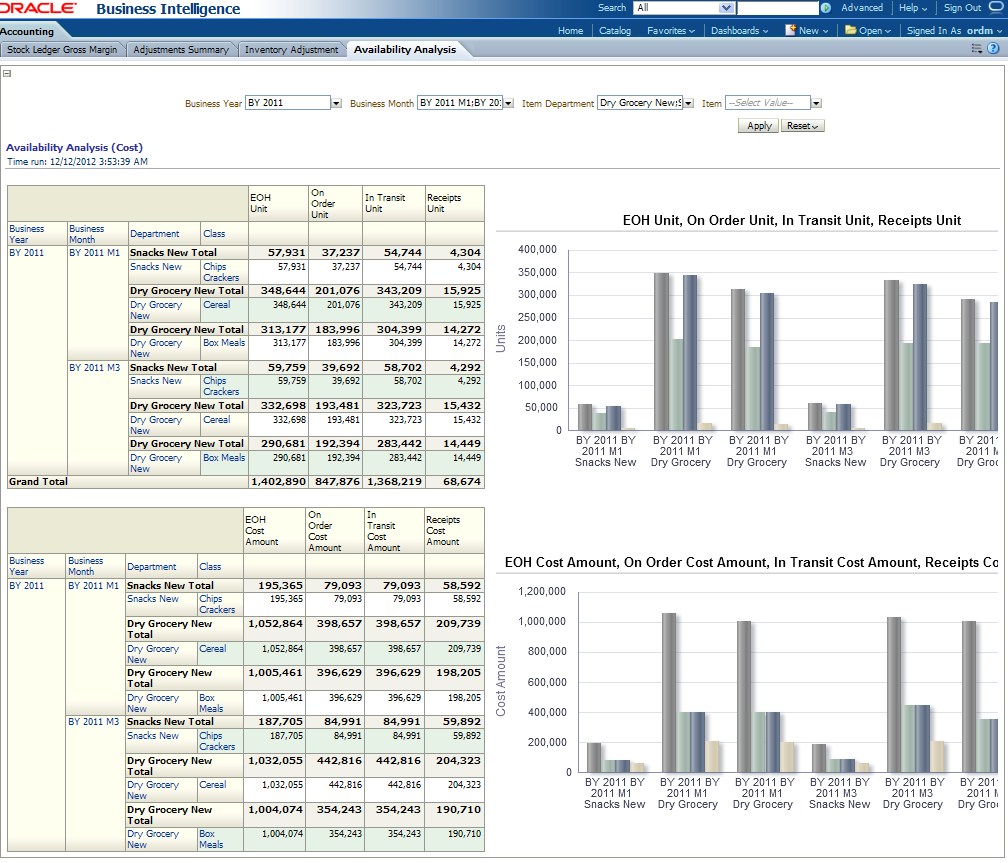
This report, as shown in Figure 13-46 analyses the yearly, monthly "Availability" information for each item department.
Report Dimensions are:
Business Time
Product
Figure 13-46 Availability Analysis Report
Compliance area includes the following reports: Vendor Compliance and Vendor Performance.
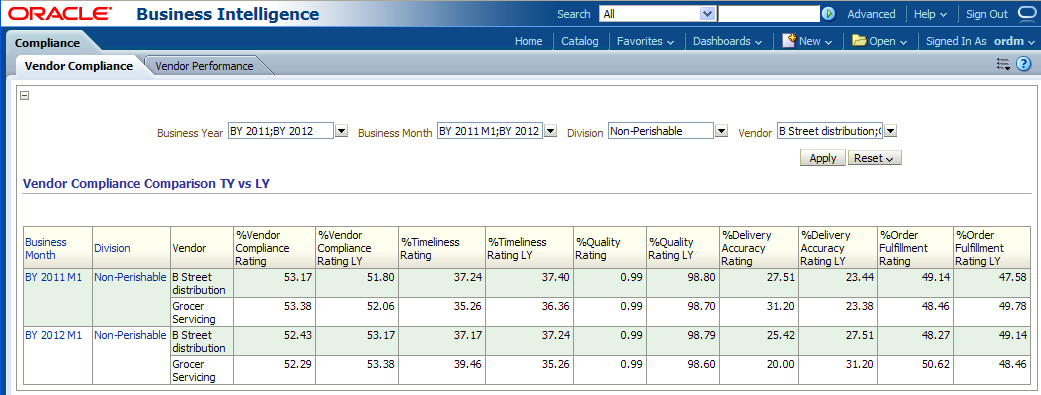
This report, as shown in Figure 13-47 provides the comparison information of current year's vendor compliance with last year for each vendor.
Report Dimensions are:
Business Time
Product
Vendor
Figure 13-47 Inventory Vendor Compliance Report
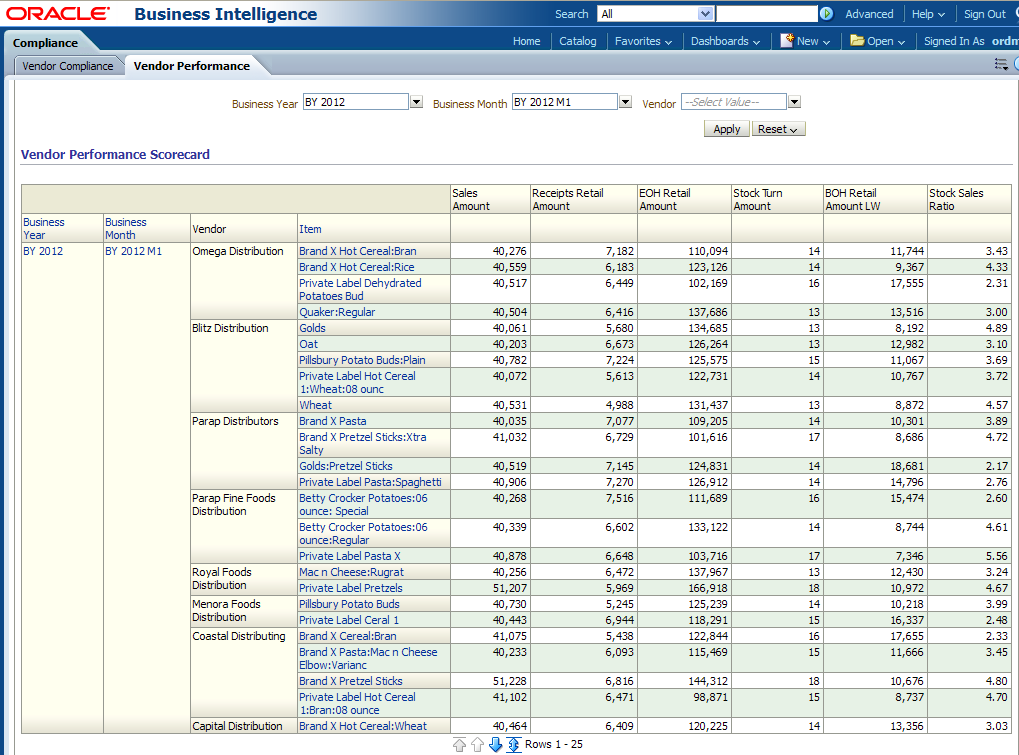
This report, as shown in Figure 13-48 provides the yearly, monthly "Vendor's performance" information for each vendor and item.
Report Dimensions are:
Business Time
Product
Vendor
Figure 13-48 Inventory Vendor Performance Report
Merchandise area includes the following reports: Comp Sales, Vendor Product, RTV Trend, Sales and Inventory Item, Vendor Sales, and Sales and Inventory.
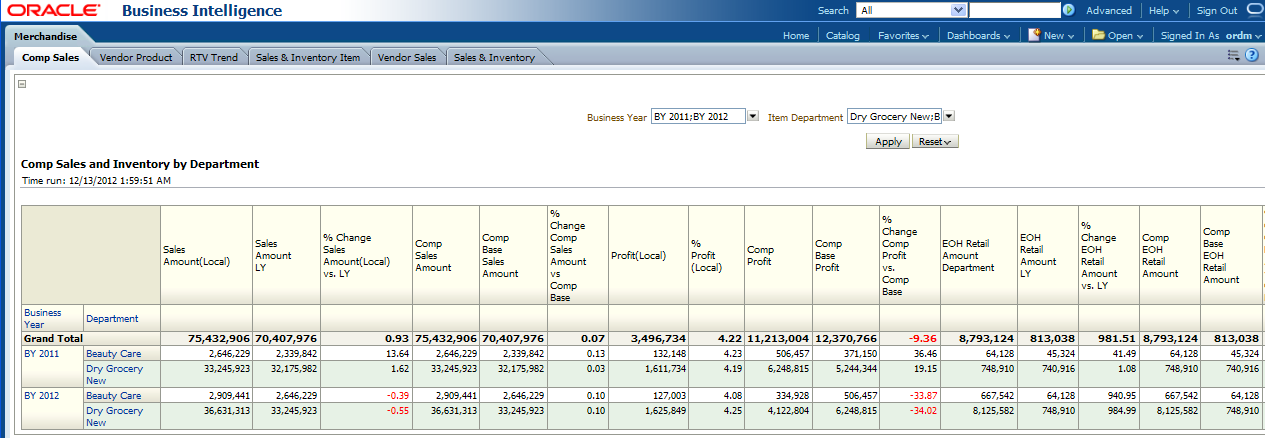
This report, as shown in Figure 13-49 provides the yearly comparison information of sales and inventory by department. You can compare the current year with last year.
Report Dimensions are:
Business Time
Product
Figure 13-49 Merchandise Comp Sales Report
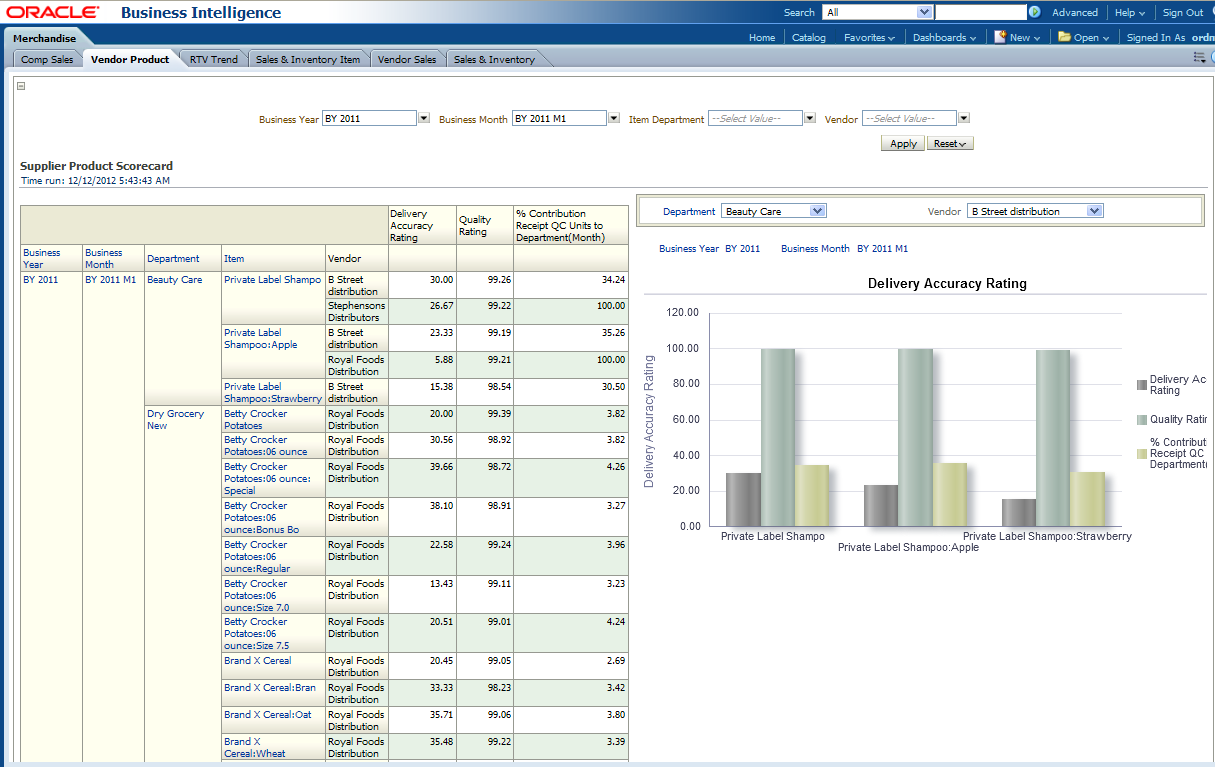
This report, as shown in Figure 13-50 provides the yearly and monthly "Supplier Product Scorecard" information for each vendor.
Report Dimensions are:
Business Time
Product
Vendor
Figure 13-50 Merchandise Vendor Product Report
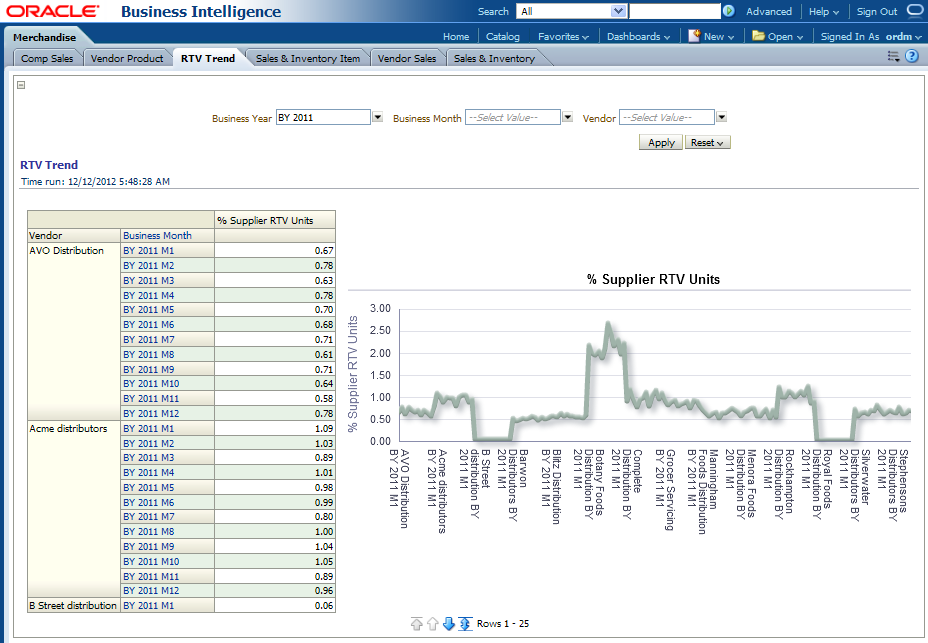
This report as shown in Figure 13-51 provides the yearly, monthly "RTV Trend" information for each vendor.
Report Dimensions are:
Business Time
Vendor
Figure 13-51 Merchandise RTV Trend Report
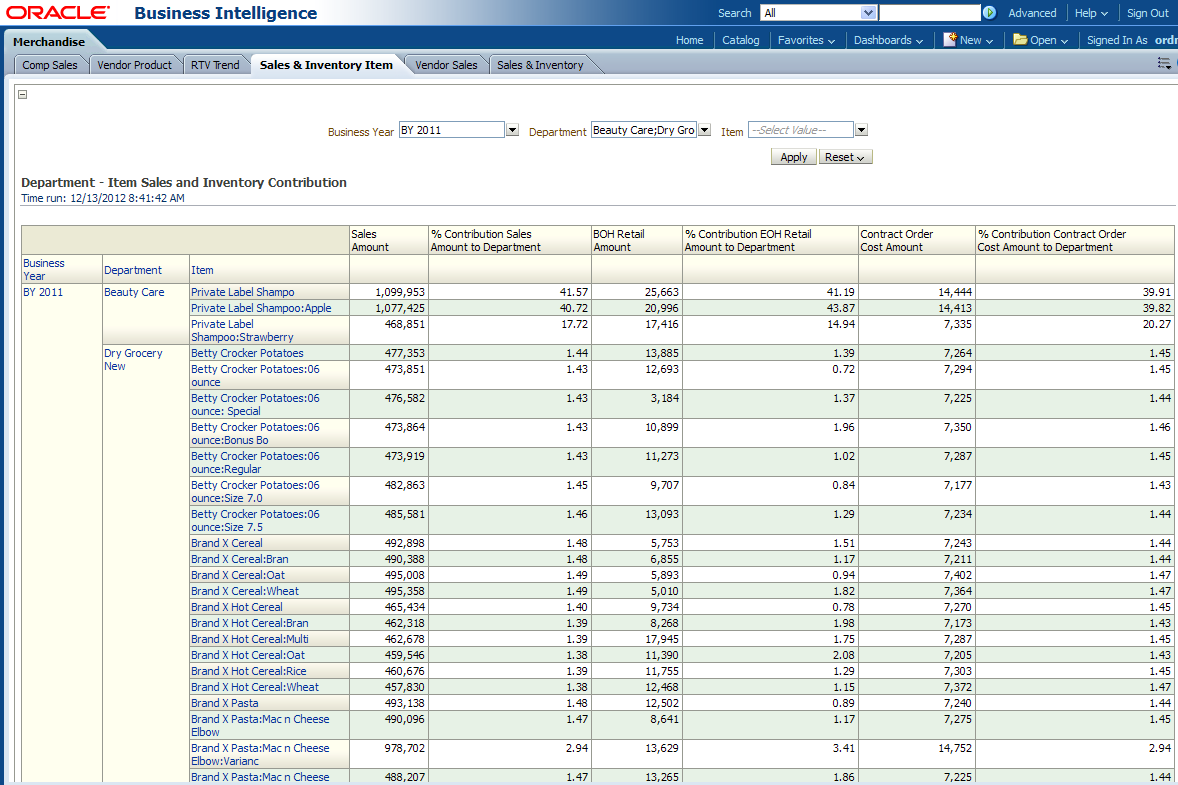
This report as shown Figure 13-52 analyses the yearly sales and profit for each vendor and product.
Report dimensions are:
Business Time
Product
Figure 13-52 Merchandise Sales and Inventory Item Report
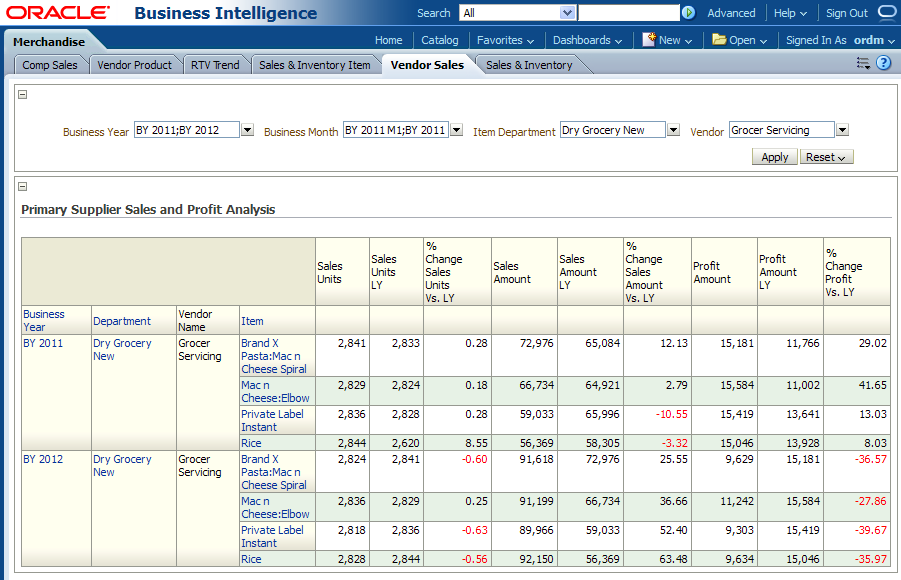
This report as shown in Figure 13-53 analyses the yearly sales and profit for each vendor and product.
Report Dimensions are:
Business Time
Vendor
Product
Figure 13-53 Merchandise Vendor Sales Report
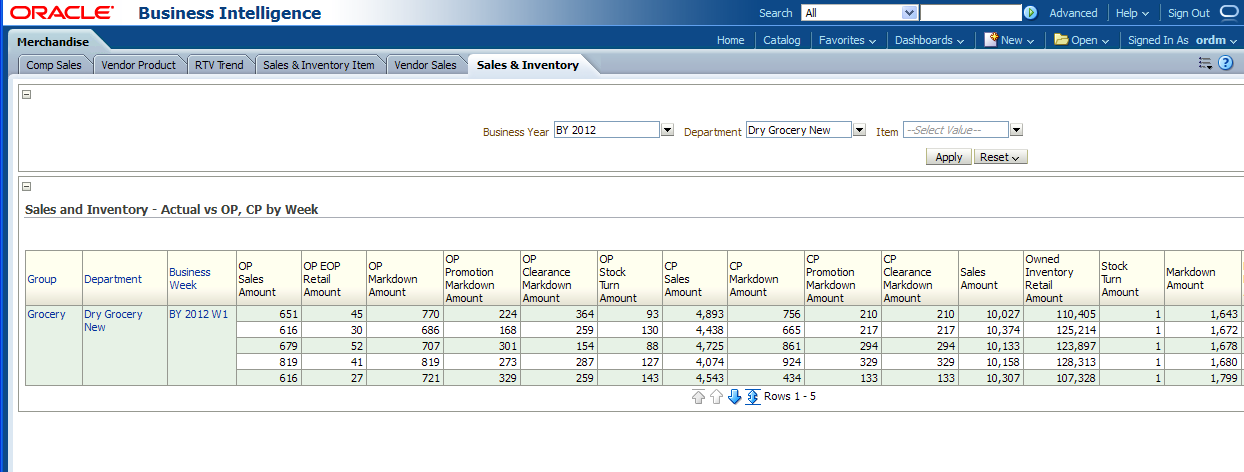
This report, as shown in Figure 13-54 provides the year level "Sales and Inventory" information for each Department and Item which can be compared with last year's metrics such as LY, and percent change LY.
Report dimensions are:
Business Time
Product
Figure 13-54 Merchandise Sales and Inventory Report
Quality Assurance area includes the following reports: Delivery Accuracy, Quality Measure, and Timeliness.
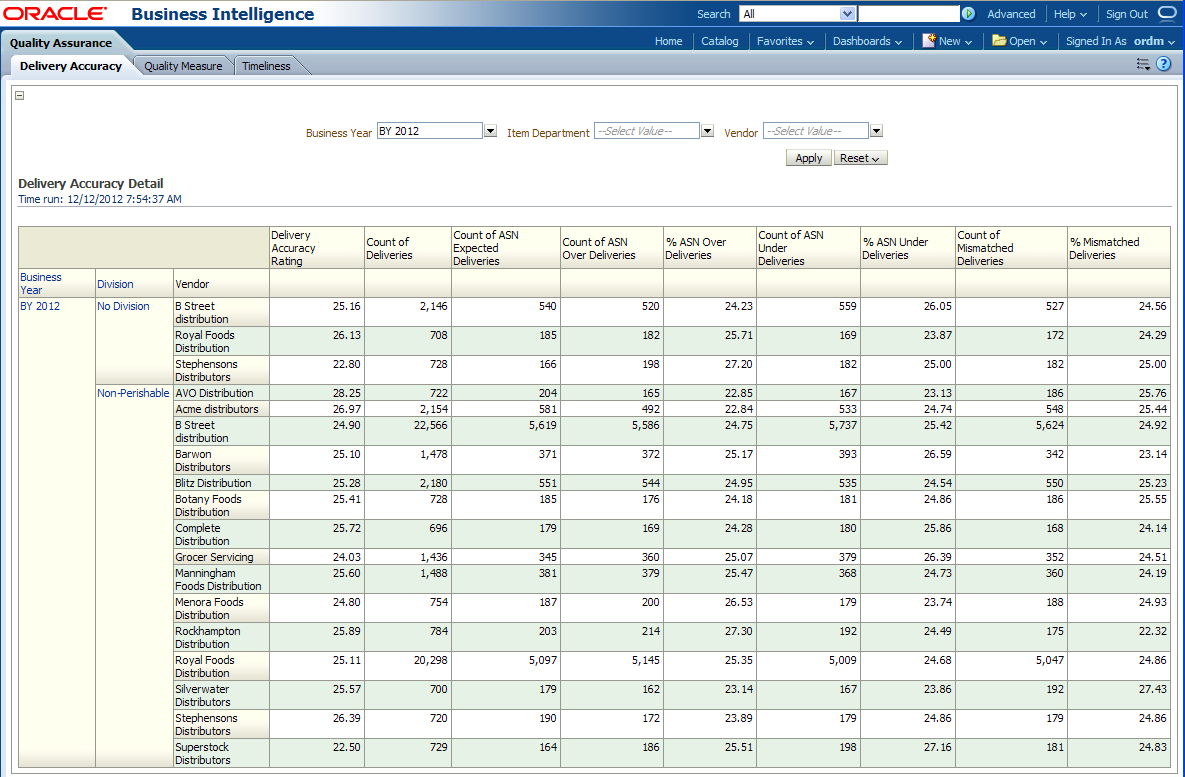
This report, as shown in Figure 13-55 provides the yearly delivery accuracy information for each product and vendor.
Report Dimensions are:
Business Time
Product
Vendor
Figure 13-55 Quality Assurance Delivery Accuracy Report
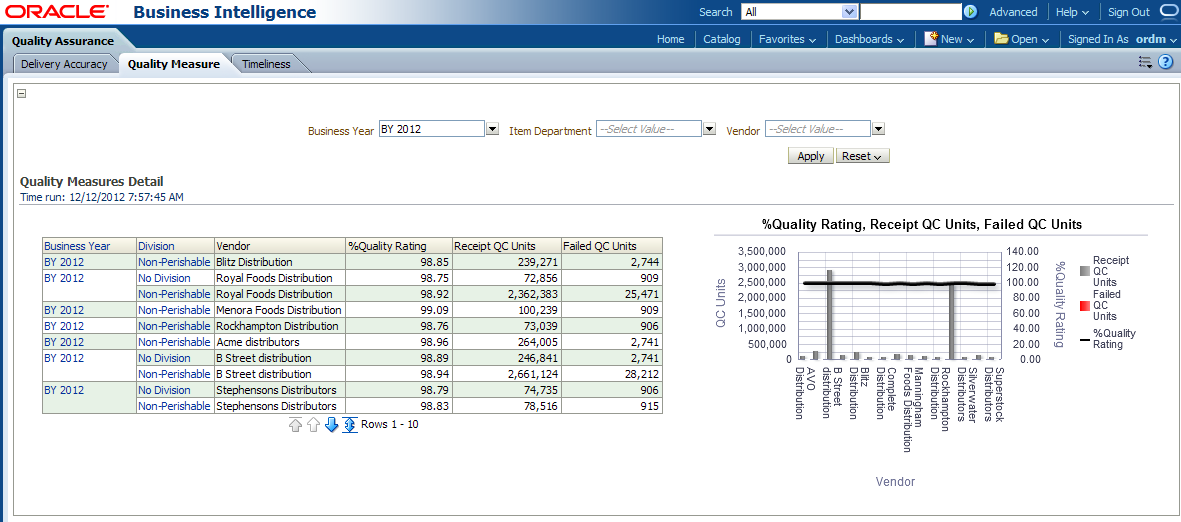
This report, as shown in Figure 13-56 provides the yearly quality measure details for each product division and vendor.
Report Dimensions are:
Business Time
Product
Vendor
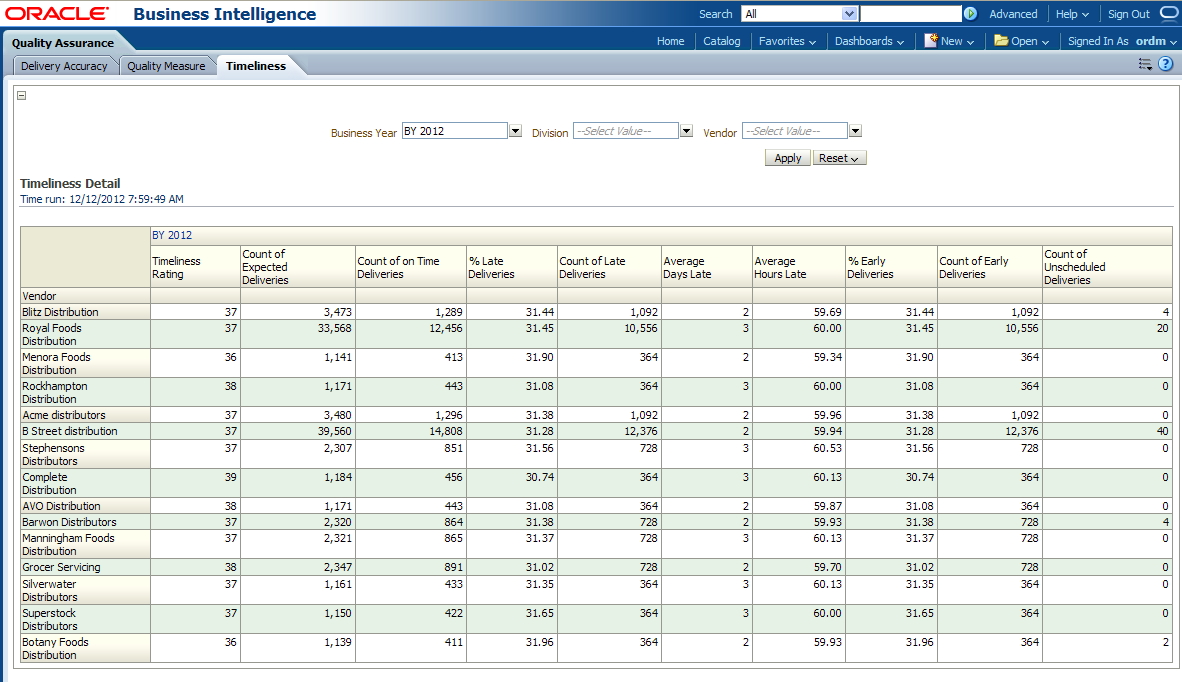
This report, as shown in Figure 13-57 provides the timeliness details for each product division vendor.
Report Dimensions are:
Business Time
Vendor
Figure 13-57 Quality Assurance Timeliness Report
Stock Movement area includes the following reports: Inventory and Receipts, and Ending On Hand (EOH) Value.
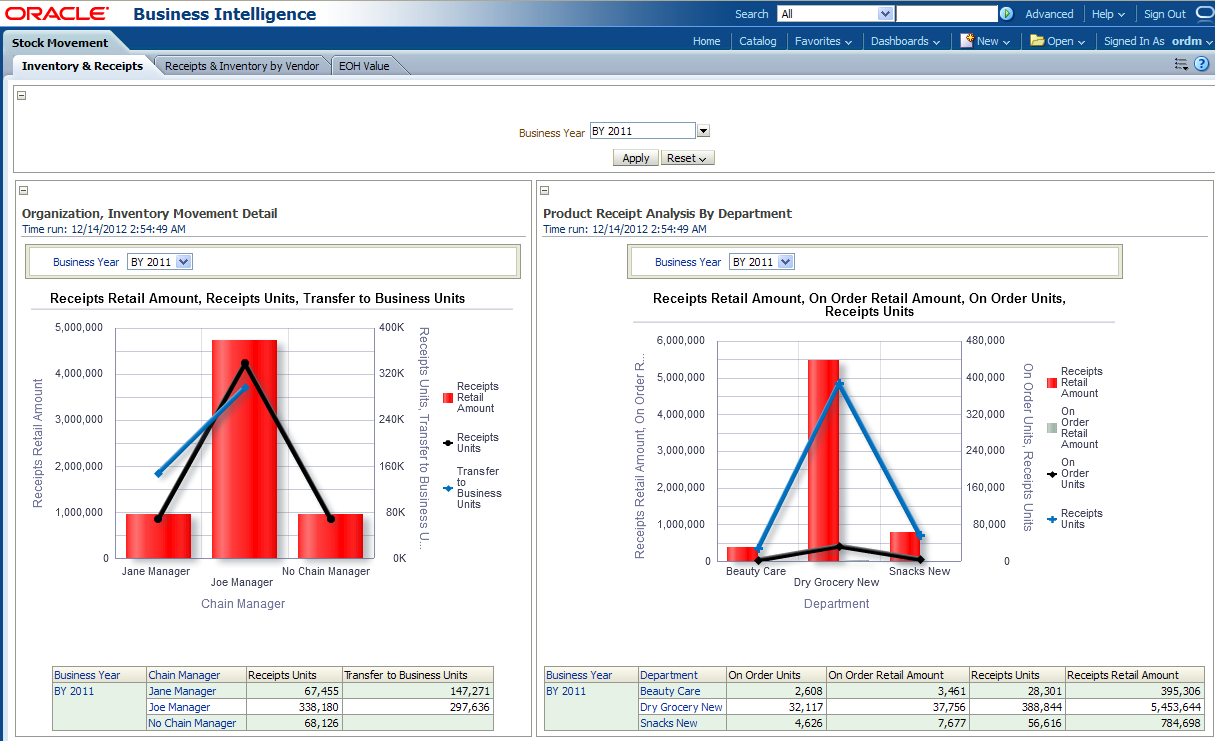
This report, as shown in Figure 13-58 provides the yearly "Inventory and Receipts" information for each department. Also provides the organization, Inventory movement details.
Report Dimensions are:
Business Time
Product
Organization
Figure 13-58 Stock Movement Inventory and Receipts
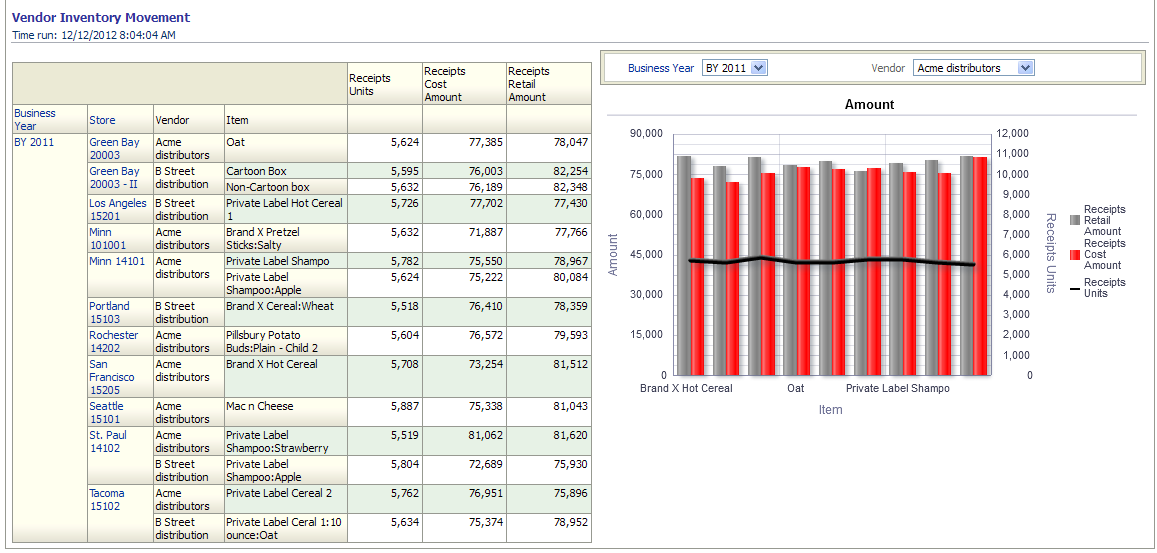
This report, as shown in Figure 13-59 and Figure 13-60 the yearly receipts details for each vendor. Also provides the "Vendor Inventory Movement" details.
Report Dimensions are:
Business Time
Product
Organization
Vendor
Figure 13-59 Stock Movement Receipts and Inventory by Vendor Report
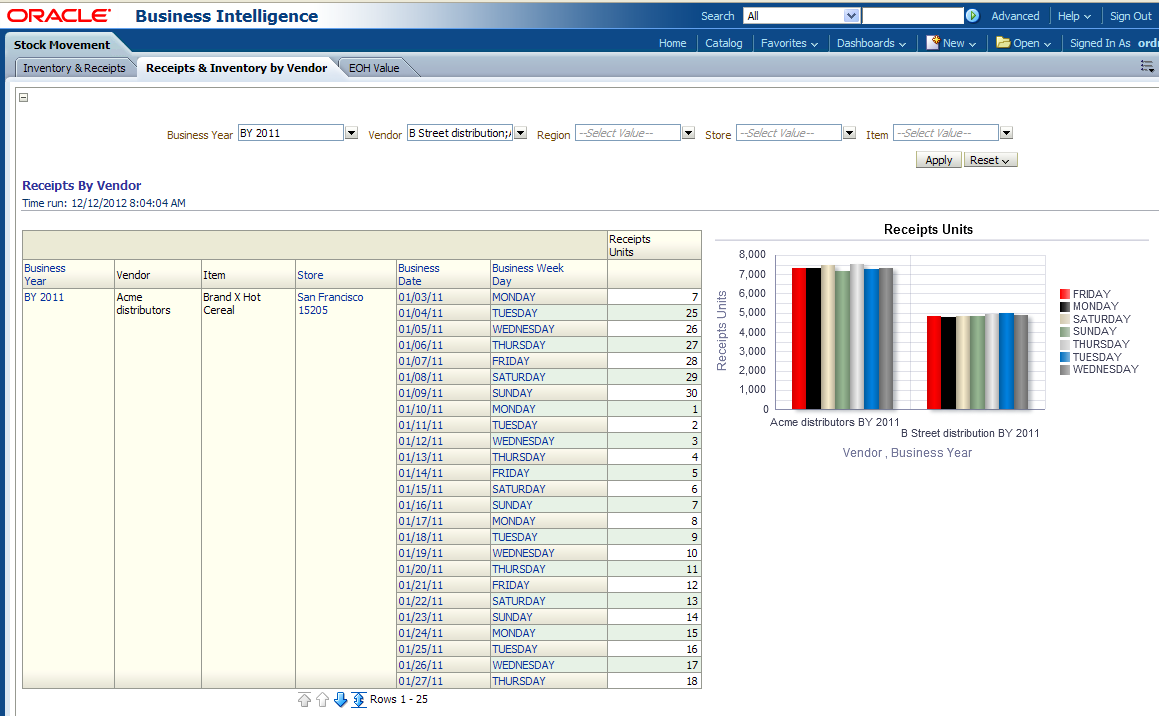
Figure 13-60 Stock Movement Vendor Inventory Report
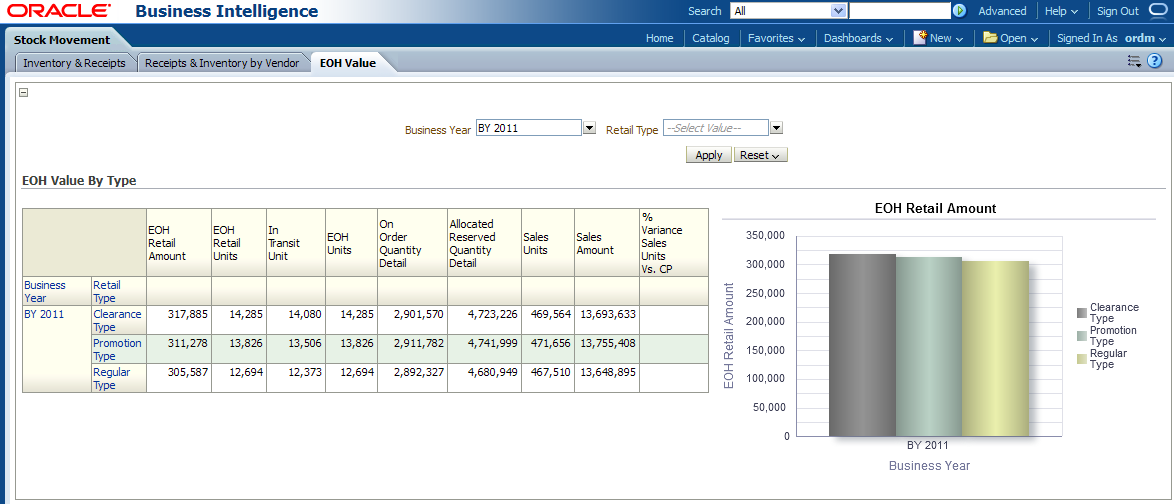
This report, as shown in Figure 13-61 provides the details about the stock at the end of a business year for each retail type.
Report Dimensions are:
Business Time
Retail Type
Figure 13-61 Ending On Hand (EOH) Value Report
Order Management Reports include the following areas: Order Status.
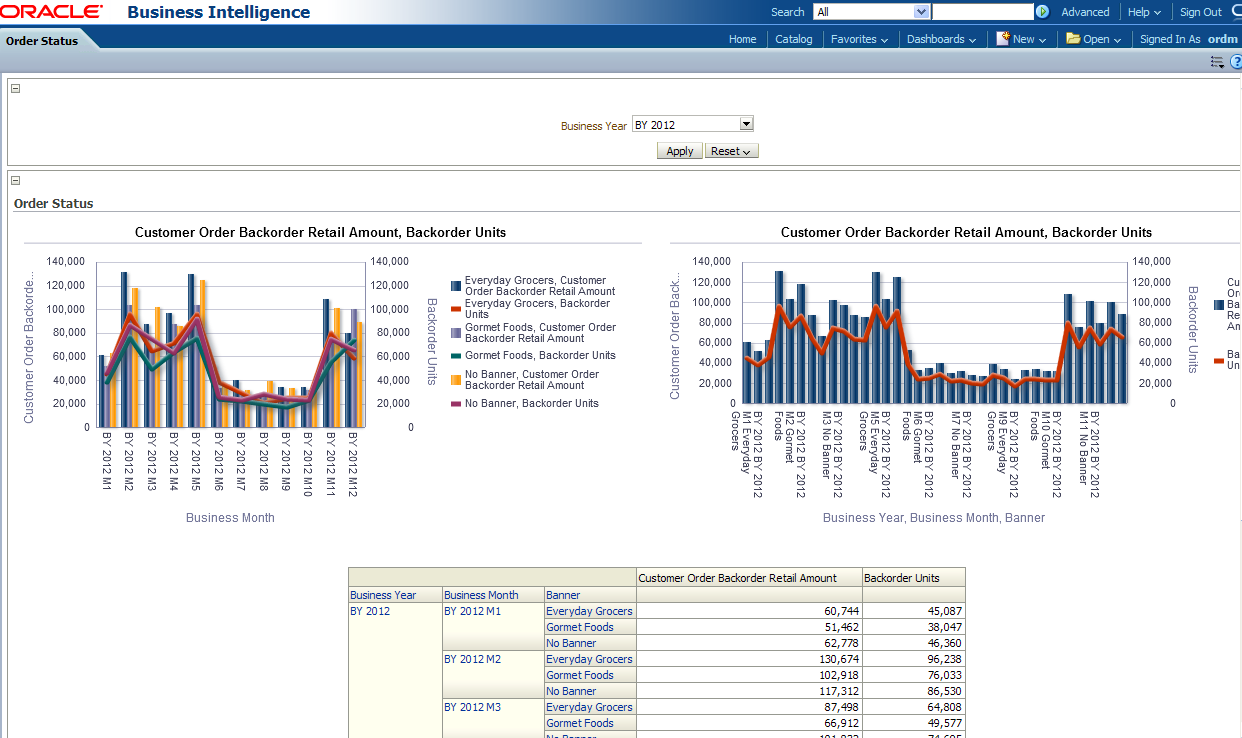
This report as shown in Figure 13-62 provides the year month-level "Order Status" information for each "Organization Banner" which can be compared with "Customer Order Backorder Retail Value" and "Backorder Units".
Report dimensions are:
Time
Organization
The Store Operation reports include the following areas:
Stock Movement area includes the following reports: Sales Analysis, and Sales Comparison.
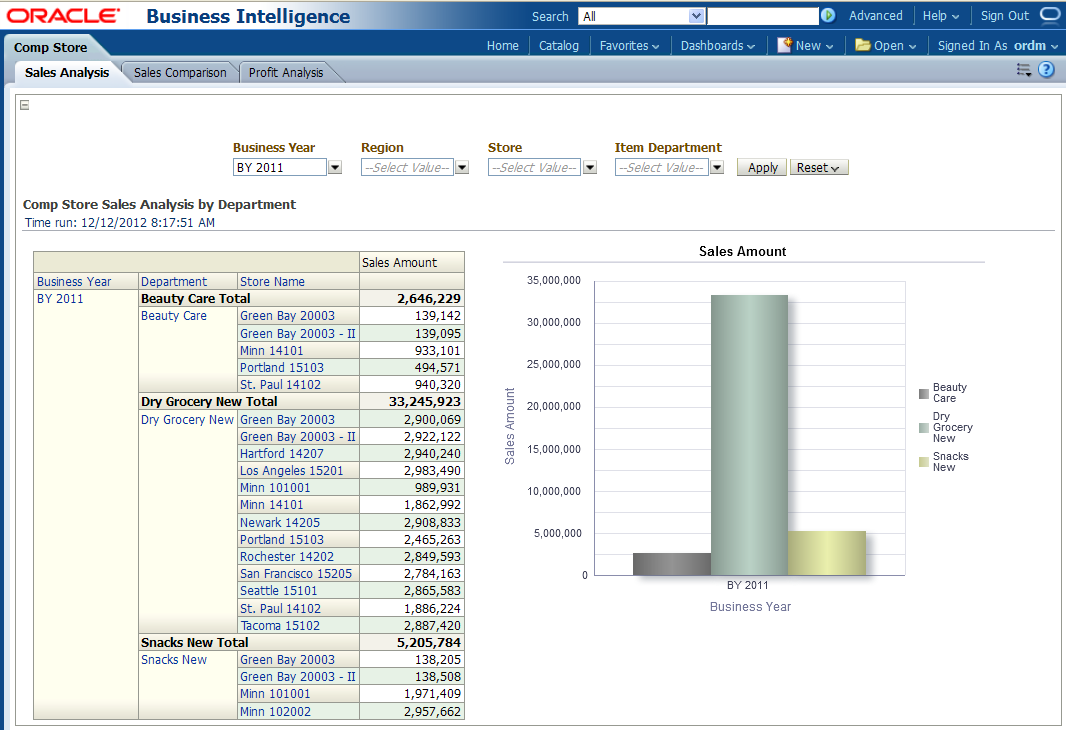
This report, as shown in Figure 13-63 provides the year level "Sales Analysis" information for each Region, Store and Item Department.
Report dimensions are:
Business Time
Organization
Product
Figure 13-63 Comp Store Sales Analysis Report
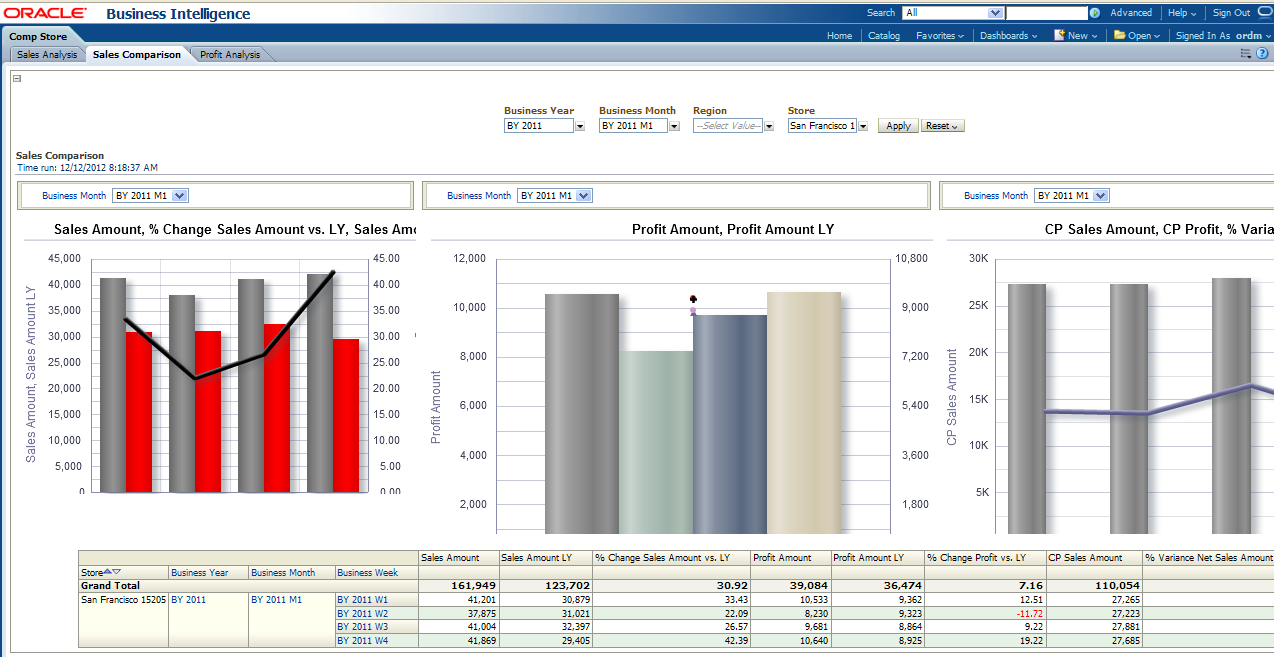
This report, as shown in Figure 13-64 provides the year month-level "Sales Comparison" information for each Region and each "Store" which can be compared with last year's metrics like LY, % Change LY.
Report dimensions are:
Business Time
Organization
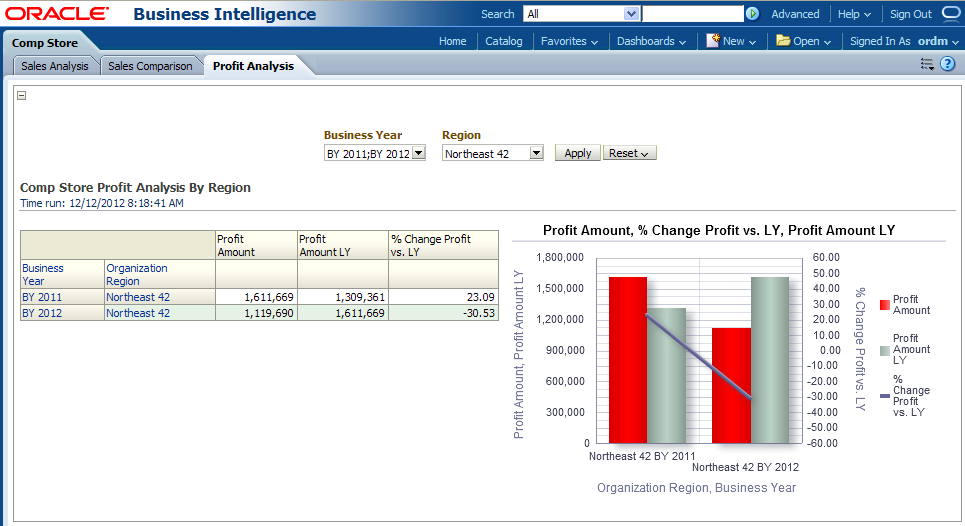
This report as shown in Figure 13-65 provides the year level "Profit Analysis" information for each Region which can be compared with last year's metrics such as LY, % Change LY.
Report dimensions are:
Business Time
Organization
Figure 13-65 Comp Store Profit Analysis Report
Store Performance area includes the following reports: Contribution, Store Performance, Ranking, and Scorecard.
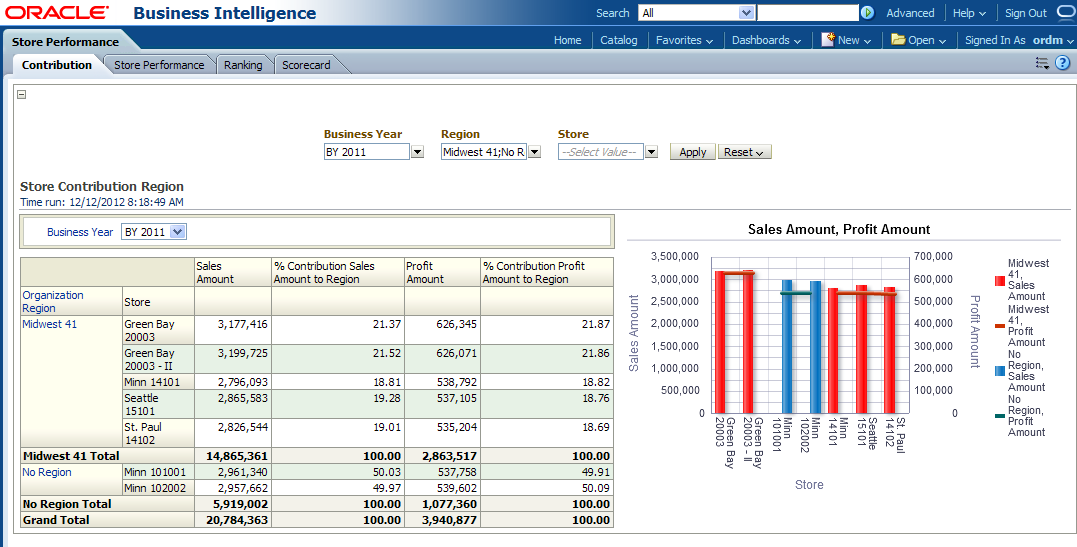
This report, as shown in Figure 13-66 provides the year level "Contribution" information for each Region and Store.
Report dimensions are:
Business Time
Organization
Figure 13-66 Store Performance Contribution Report
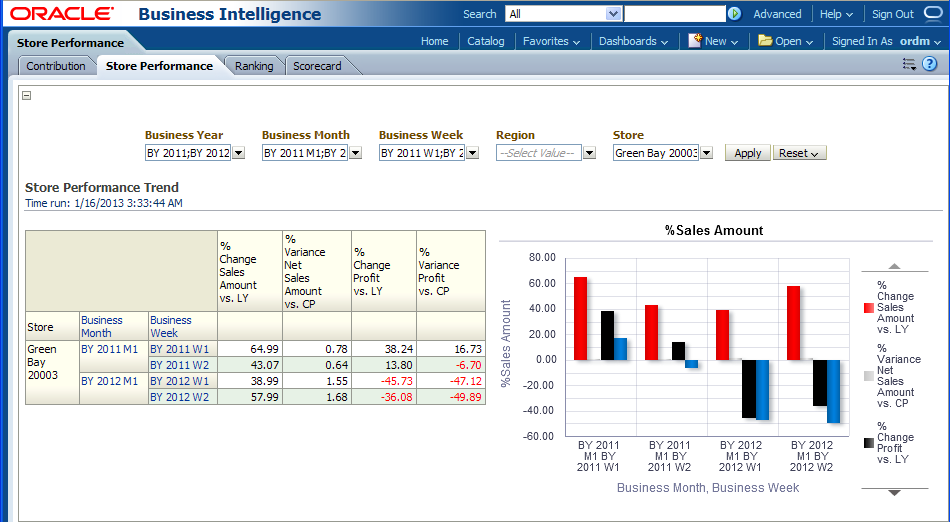
This report, as shown in Figure 13-67 provides the year month week-level "Store Performance Trend" information for each "Store" with respect to each "Organization Region" which can be compared with last year's metrics like LY, % Change LY.
Report dimensions are:
Business Time
Organization
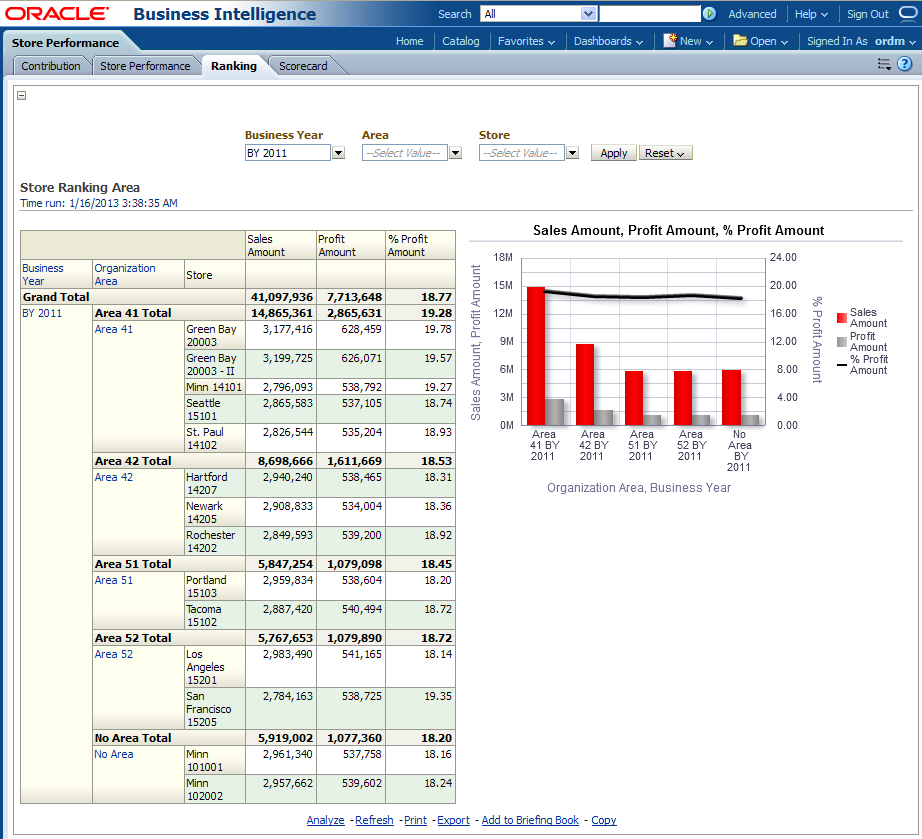
This report, as shown in Figure 13-68 provides the year level "Ranking" information for each Area and "Store".
Report dimensions are:
Business Time
Organization
Figure 13-68 Store Performance Ranking Report
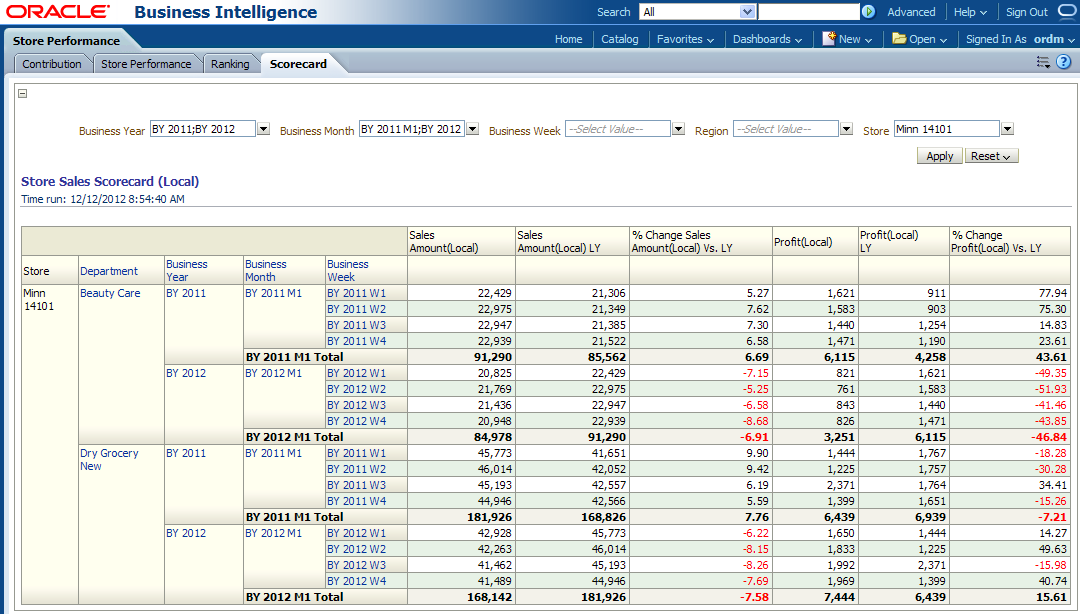
This report, as shown in Figure 13-69 provides the store sales scorecard,(Local) information for each Area and "Store".
Report dimensions are:
Business Time
Organization
Figure 13-69 Store Performance Scorecard Report
Over/Short area includes the following reports: Employee Over/Short and Store Over/Short.
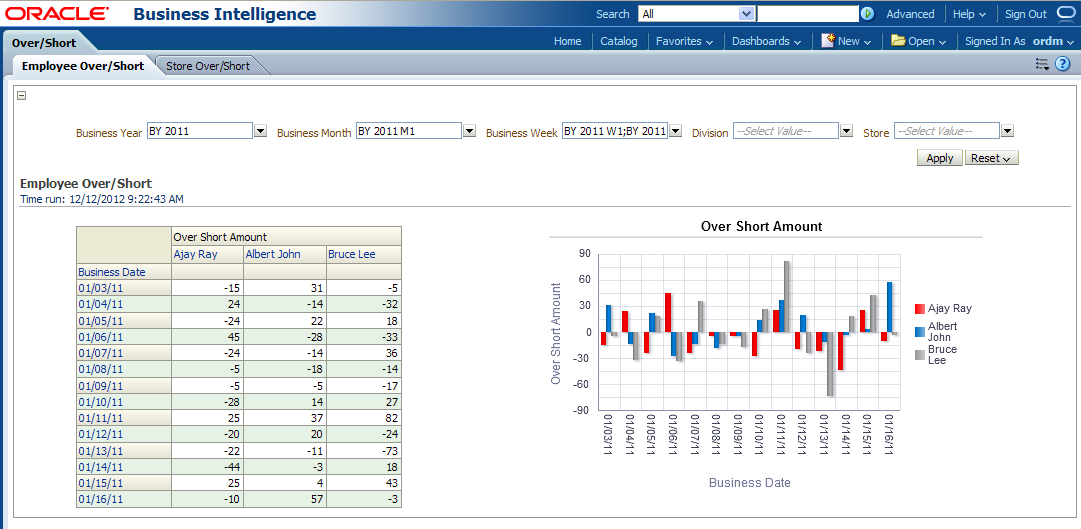
This report, as shown in Figure 13-70 provides the year month week-level "Employee Over/Short" information for each Employee with respect to each "Organization Division" and "Store".
Report dimensions are:
Business Time
Organization
Employee
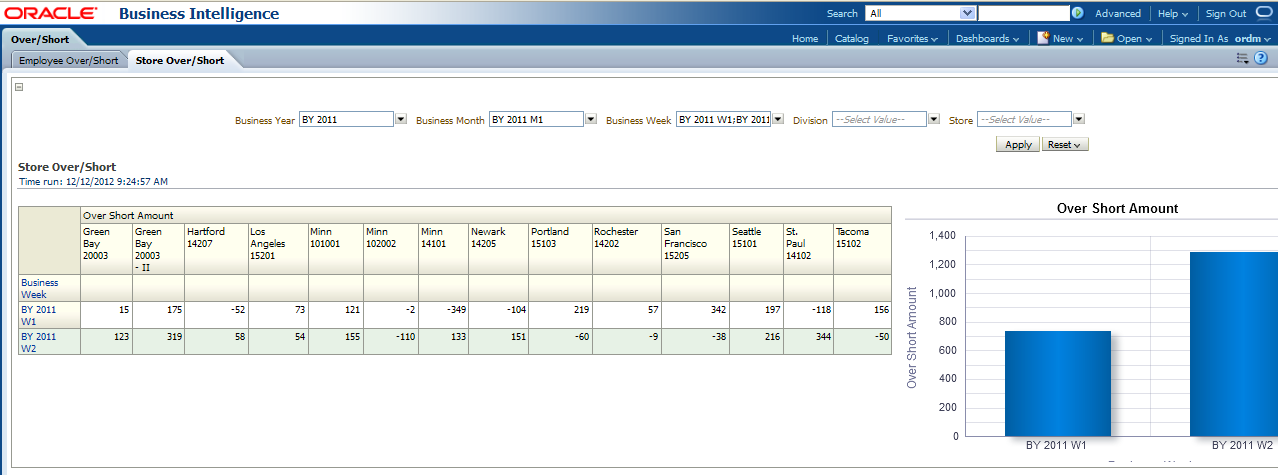
This report, as shown in Figure 13-71 provides the year month week-level "Store Over/Short" information for each "Store" with respect to each "Organization Division".
Report dimensions are:
Business Time
Organization
Traffic area includes the following reports: Store Traffic Day and Store Traffic Week.
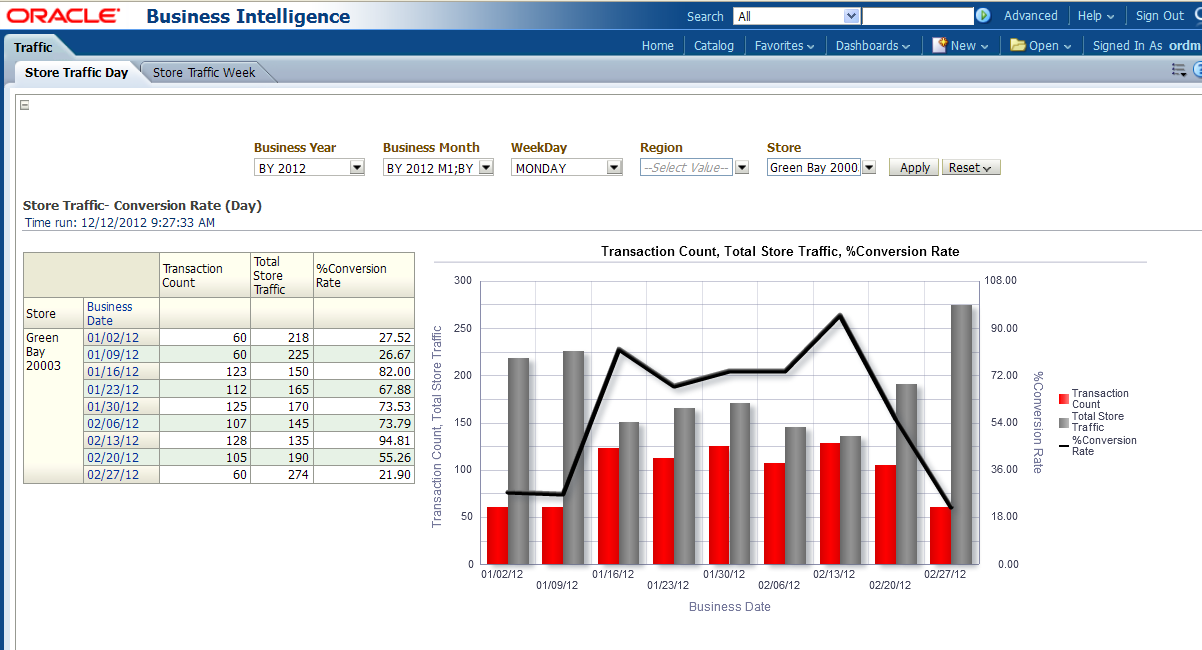
This report, as shown in Figure 13-72 provides the year month weekday-level "Store Traffic-Conversion Rate" information for each "Store" with respect to each "Organization Region".
Report dimensions are:
Business Time
Organization
Figure 13-72 Traffic Store Traffic Day Report
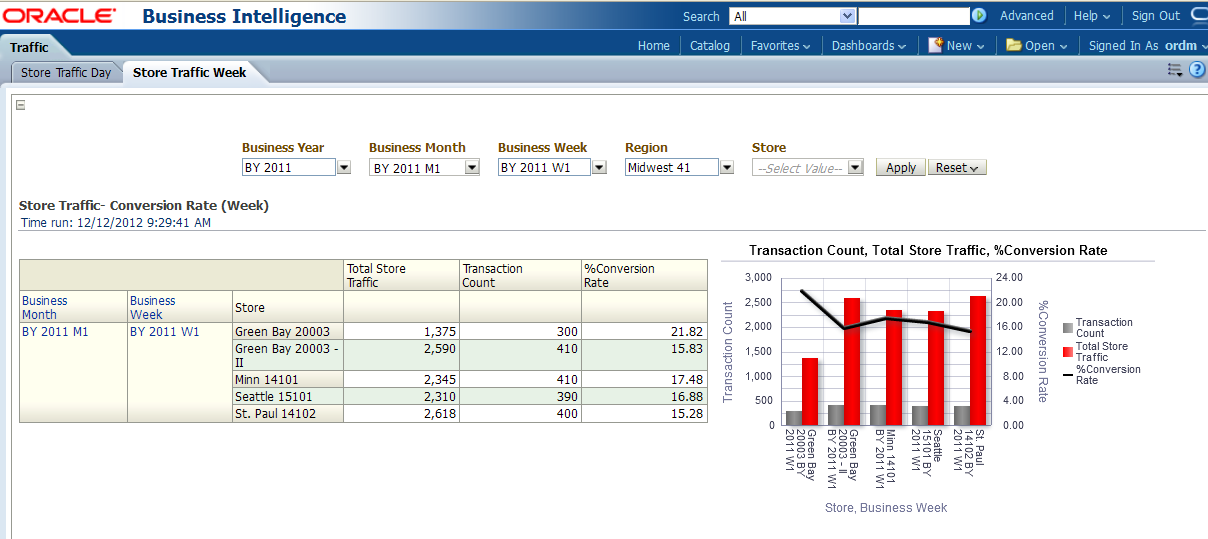
This report, as shown in Figure 13-73 provides the year month week-level "Store Traffic-Conversion Rate" information for each "Store" with respect to each "Organization Region".
Report dimensions are:
Business Time
Organization
Transaction includes the Hourly Sales and Hourly Sales Trend reports.
This report, as shown in Figure 13-74 provides the yearly hour-level "Hourly Sales" information for each "Store" with respect to each "Organization Region "which can be compared with Net Sales Amount and Number of Sales Transactions.
Report dimensions are:
Business Time
Organization
Time of Day
Figure 13-74 Store Operation Transaction Hourly Sales Report
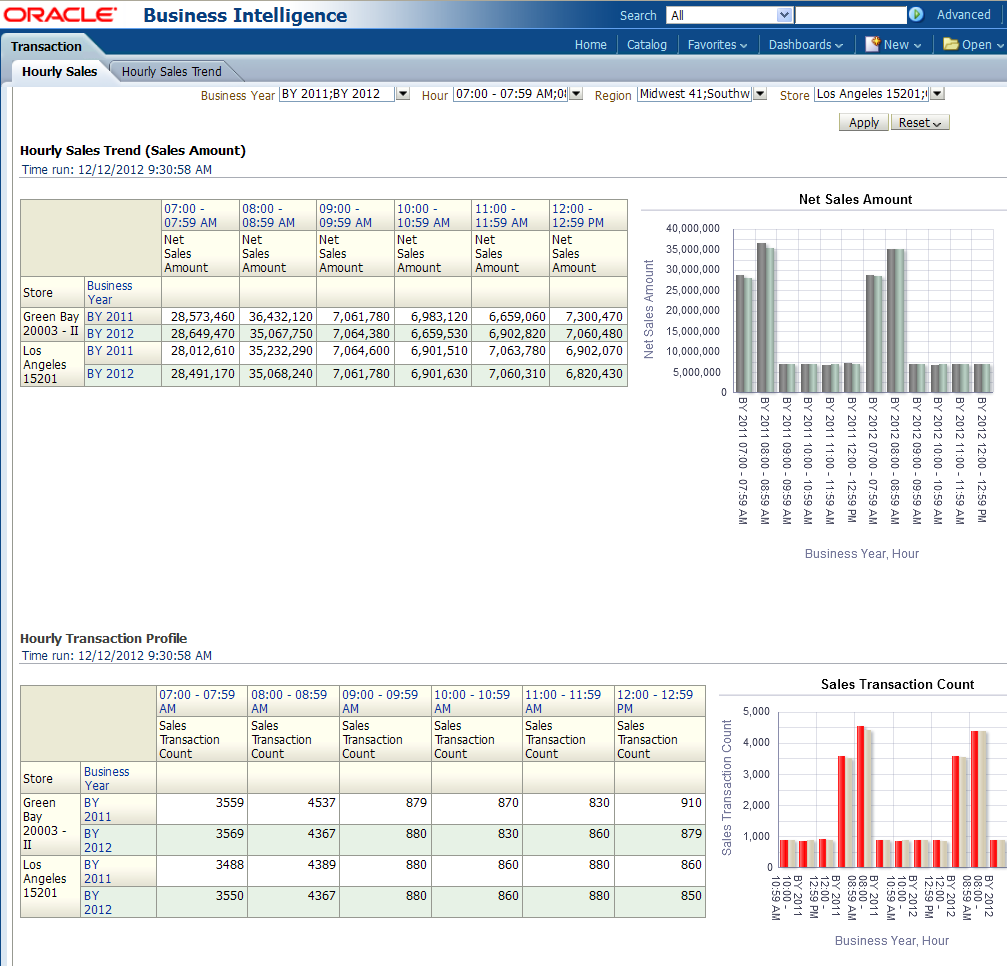
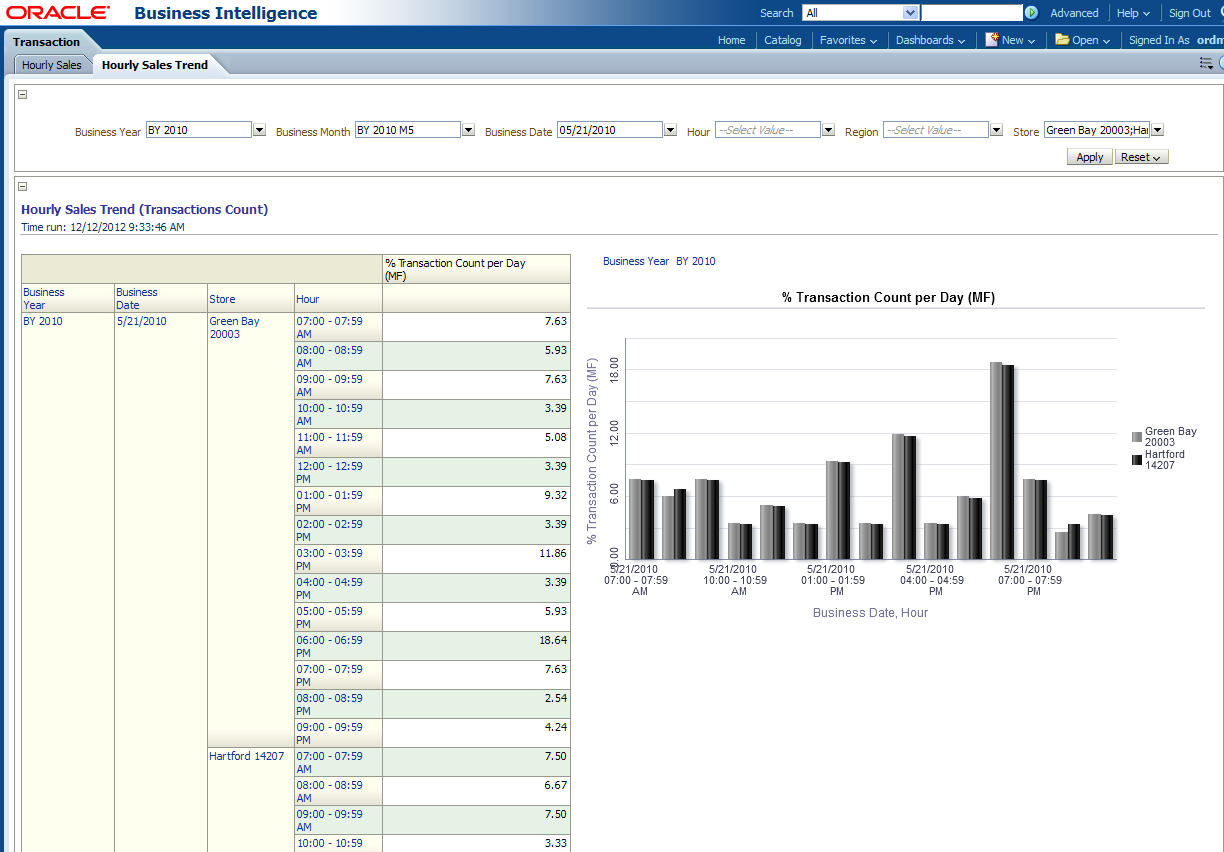
This report, as shown in Figure 13-75 provides the yearly hour-level "Hourly Sales Trend" information for each "Store" with respect to each "Organization Region "which can be compared with % Hourly No. of Transaction to Total Day.
Report dimensions are:
Business Time
Organization
Time of Day
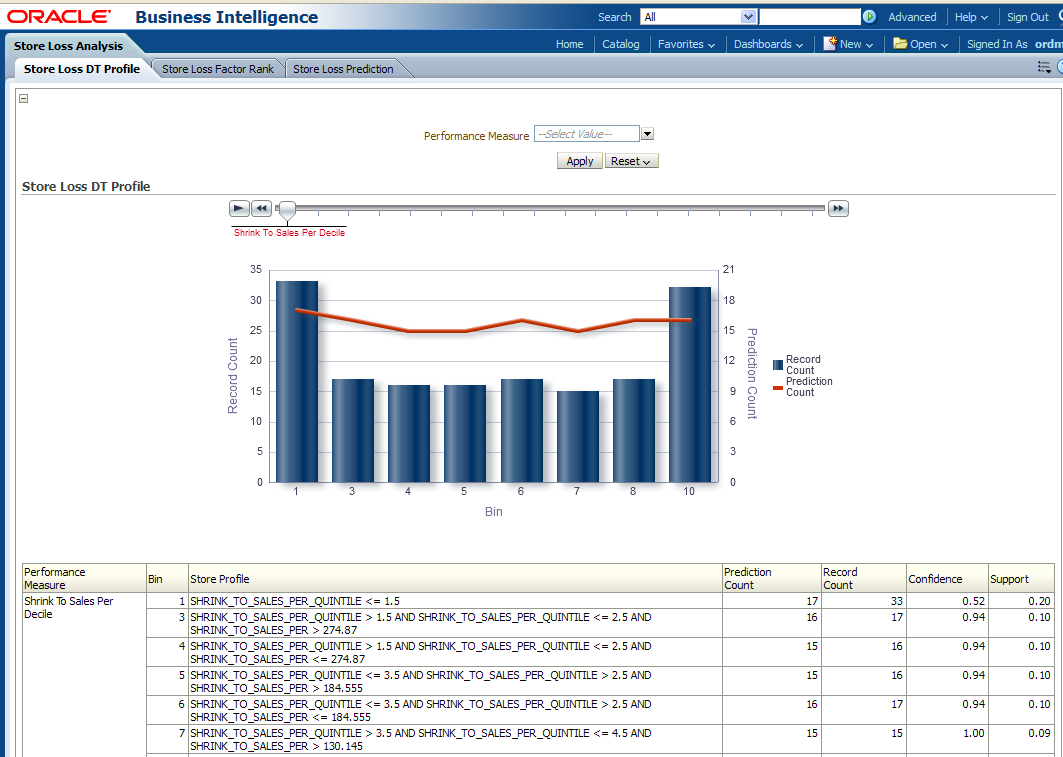
This report, as shown in Figure 13-76 provides the reduction in inventory.
Report dimensions are:
Business Time
Organization
Tender Trend
Figure 13-76 Store Loss Analysis Store Loss DT Profile Report
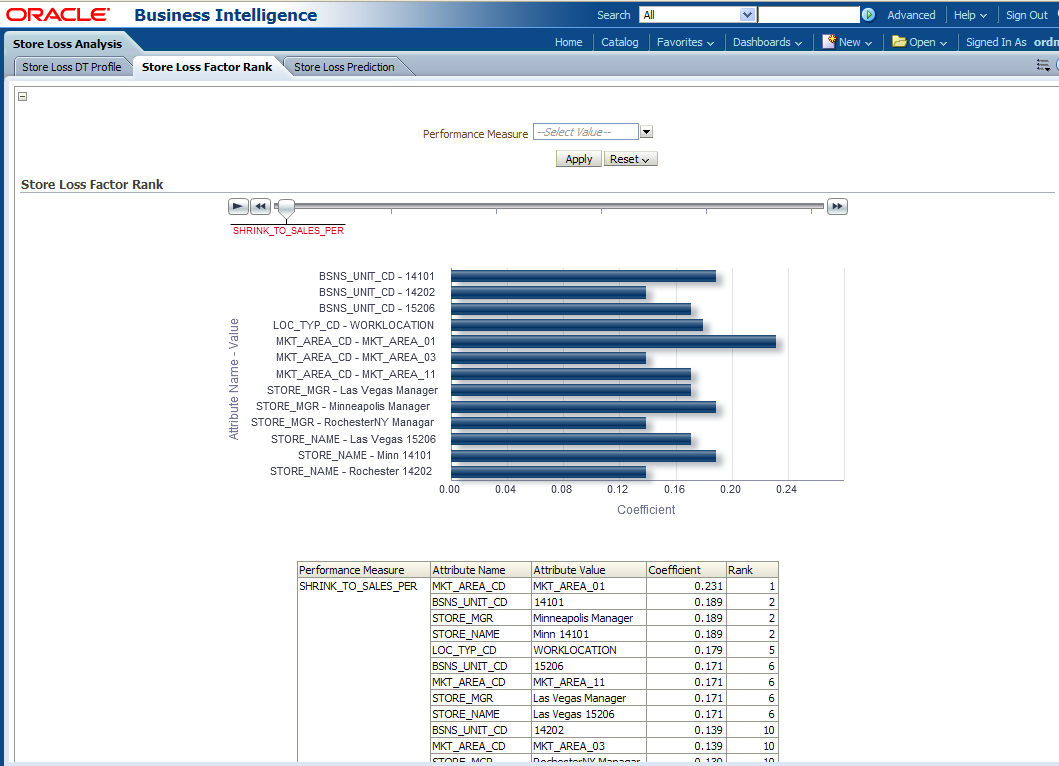
This report, as shown in Figure 13-77 provides the reduction in inventory (due to damage, spoilage and so forth).
Report dimensions are:
Business Time
Organization
Tender Trend
Figure 13-77 Store Loss Analysis Store Loss Factor Rank Report
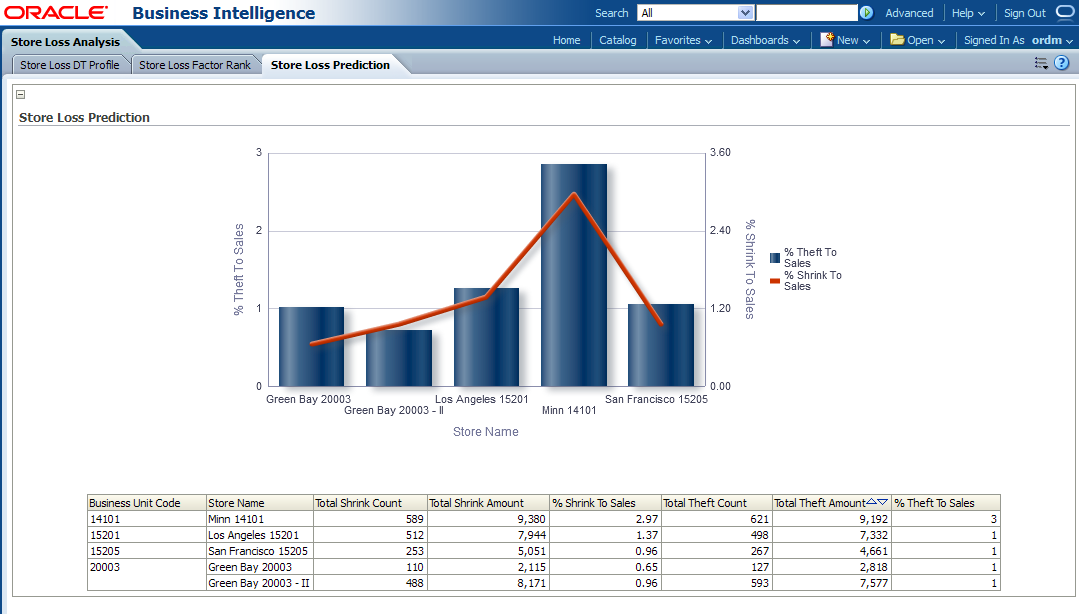
This report, as shown in Figure 13-78 provides the reduction in inventory (due to damage, spoilage and so forth).
Report dimensions are:
Business Time
Organization
Tender Trend
Figure 13-78 Store Loss Prediction Report
|
Copyright © 2009, 2013, Oracle and/or its affiliates. All rights reserved. Legal Notices |
|