| Oracle® Retail Data Model Reference Release 11.3.2 E20361-03 |
|
|
PDF · Mobi · ePub |
| Oracle® Retail Data Model Reference Release 11.3.2 E20361-03 |
|
|
PDF · Mobi · ePub |
This chapter provides Oracle Retail Data Model sample reports.
This chapter includes the following sections:
The customer reports include the following:
The demography area includes the following reports.
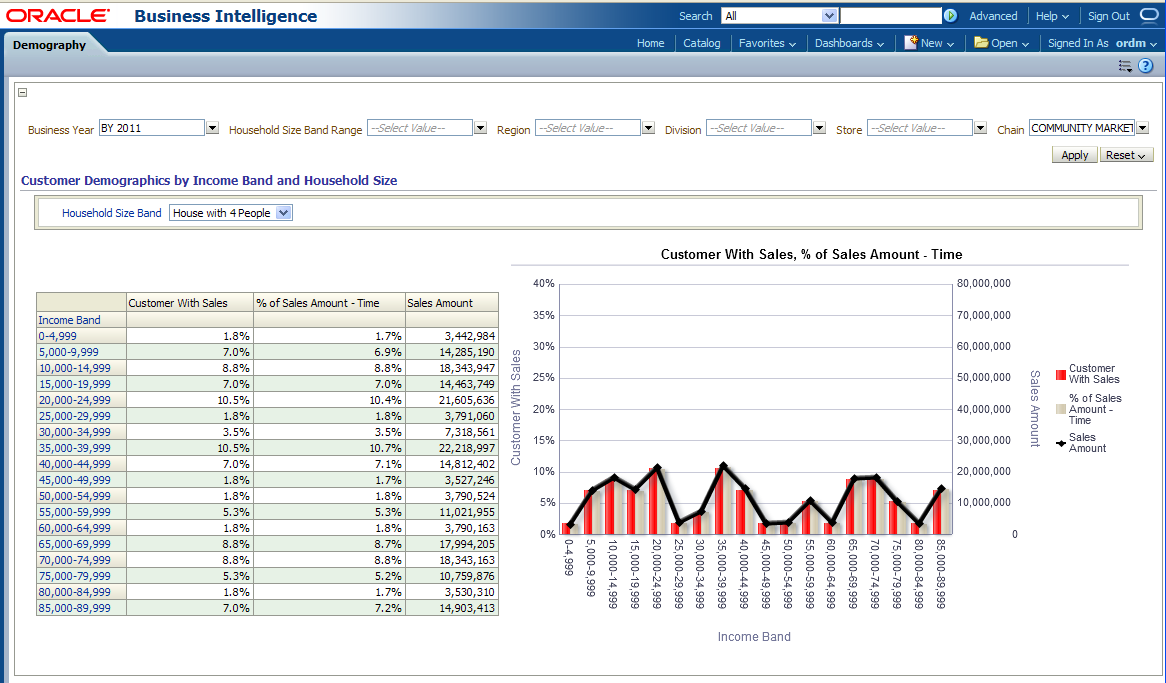
Figure 12-1 provides count and sales information based on income band range. You can compare customer sales count, sales amount and % sales amount for each income band range.
Report dimensions are:
Business Time
Household Size Band Range
Organization
Figure 12-1 Customer Demographics by Income Band and Household Size Report
The frequent shopper area includes the following reports: Frequent Shopper Penetration, Frequent Shopper Sales Analysis, Frequent Shopper Transactions, and Frequent Shopper Distribution.
Figure 12-2 shows frequent shopper transaction as percent of total transactions (time series analysis).
Report dimensions are:
Business Time
Organization
Figure 12-2 Frequent Shopper Penetration Report
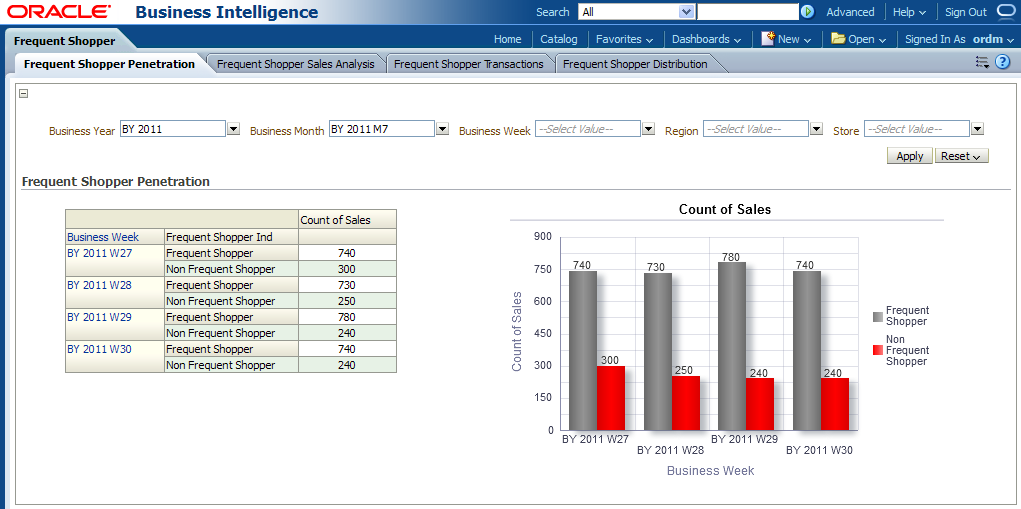
Figure 12-3 shows how much the frequent shoppers contribute to total sales (by item-class).
Report dimensions are:
Business Time
Product
Figure 12-3 Frequent Shopper Sales Analysis
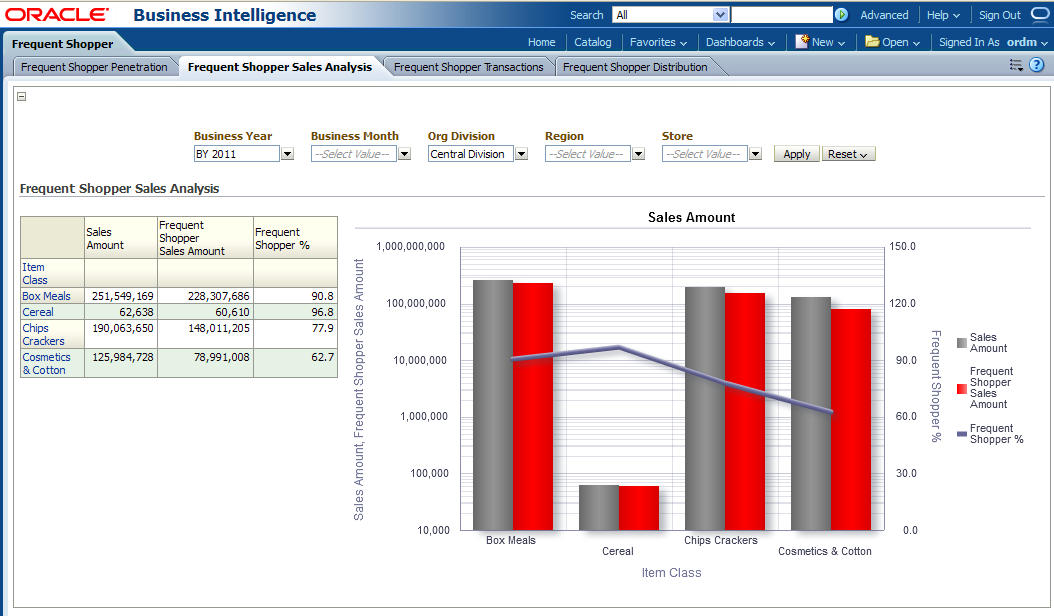
Figure 12-4 provides frequent shopper transactions.
Report dimensions are:
Business Time
Organization
Figure 12-4 Frequent Shopper Transactions
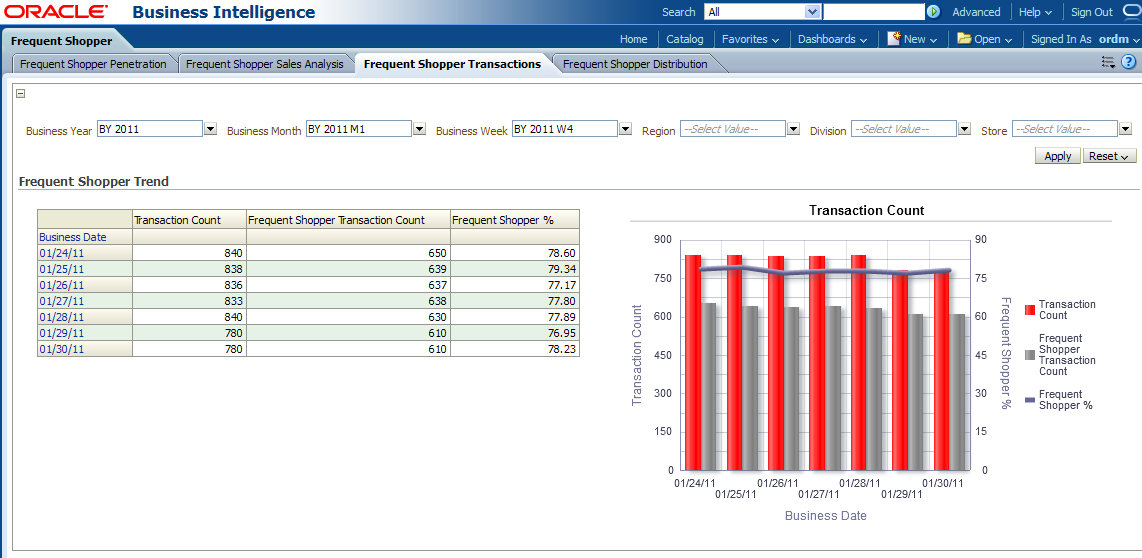
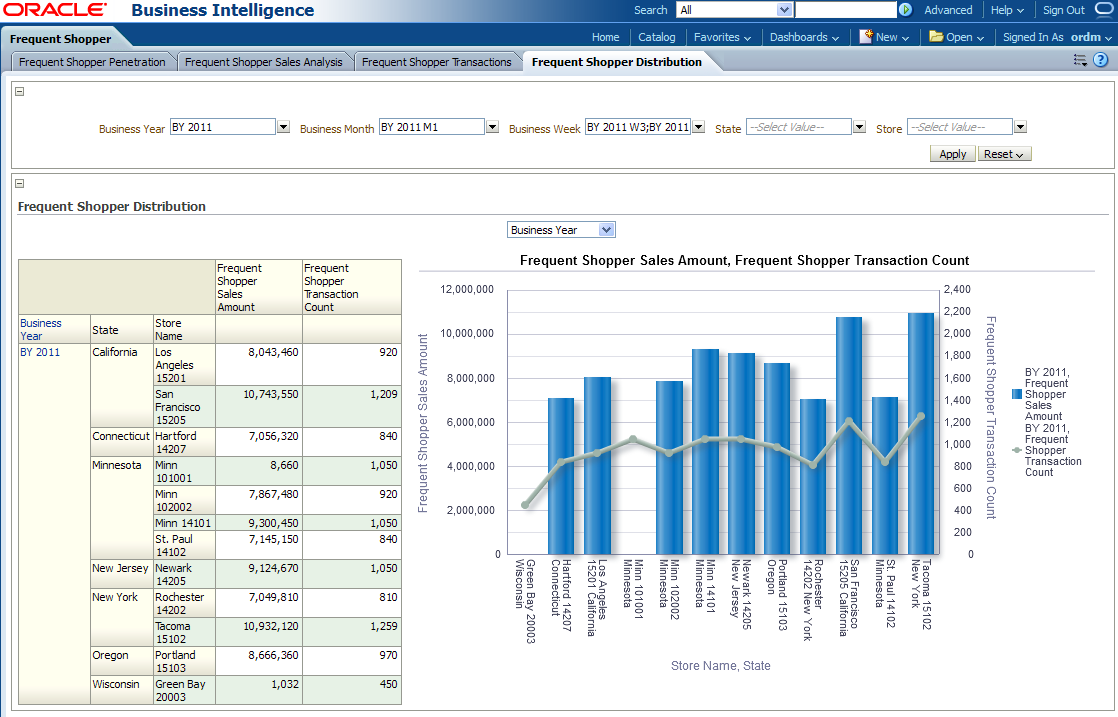
Figure 12-5 frequent shopper distribution.
Report dimensions are:
Business Time
Customer
Figure 12-5 Frequent Shopper Distribution Report
The RFMP & Cluster area includes the following reports: RFM Scoring, RFMP Trending, Cluster Analysis, and Frequency Defection.
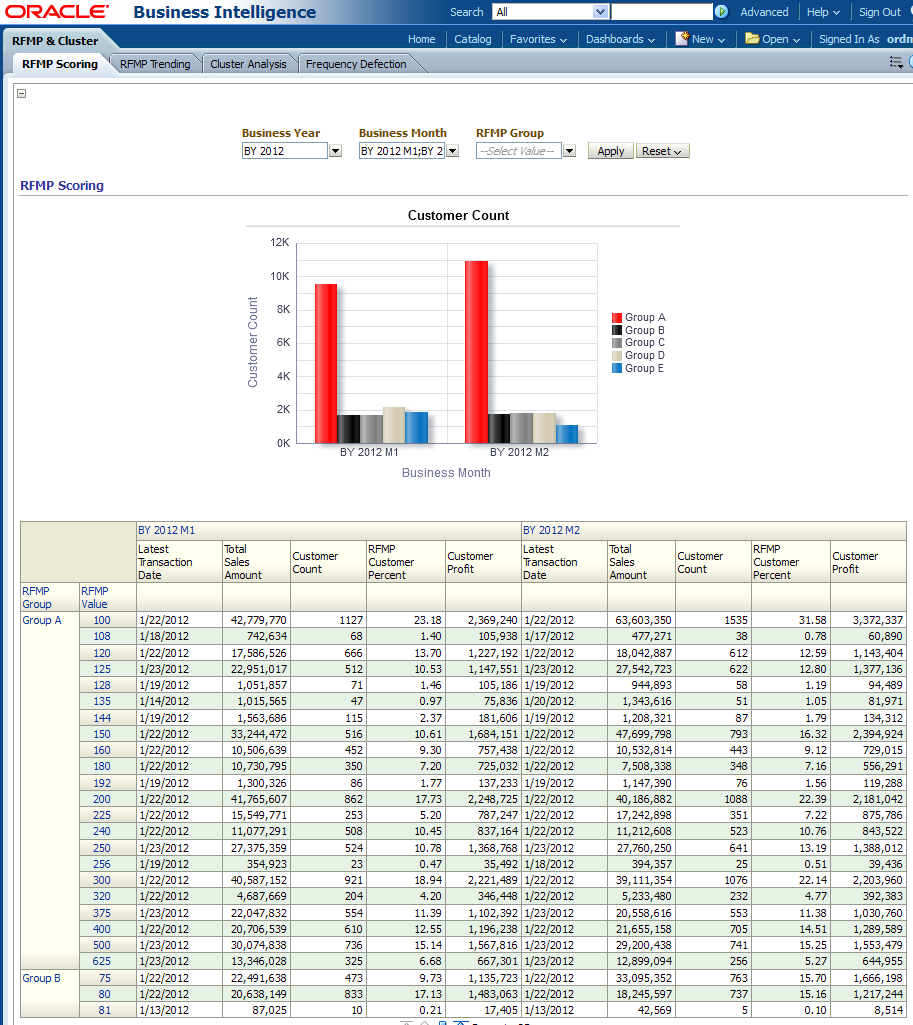
Figure 12-6 provides RFMP groupings statistics over time.
Report dimensions are:
Business Time
Customer
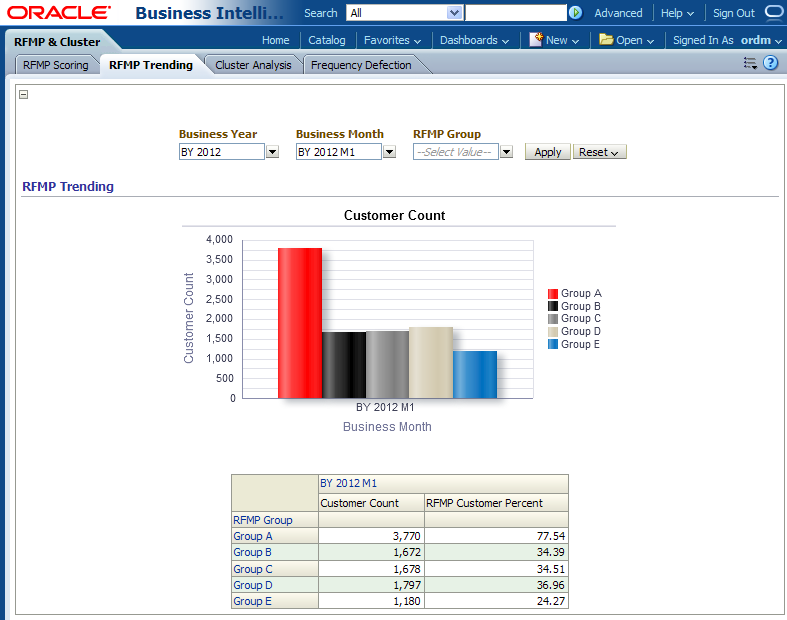
This report, as shown in Figure 12-7 provides month to month RFMP group migration.
Report dimensions are:
Business Time
Customer
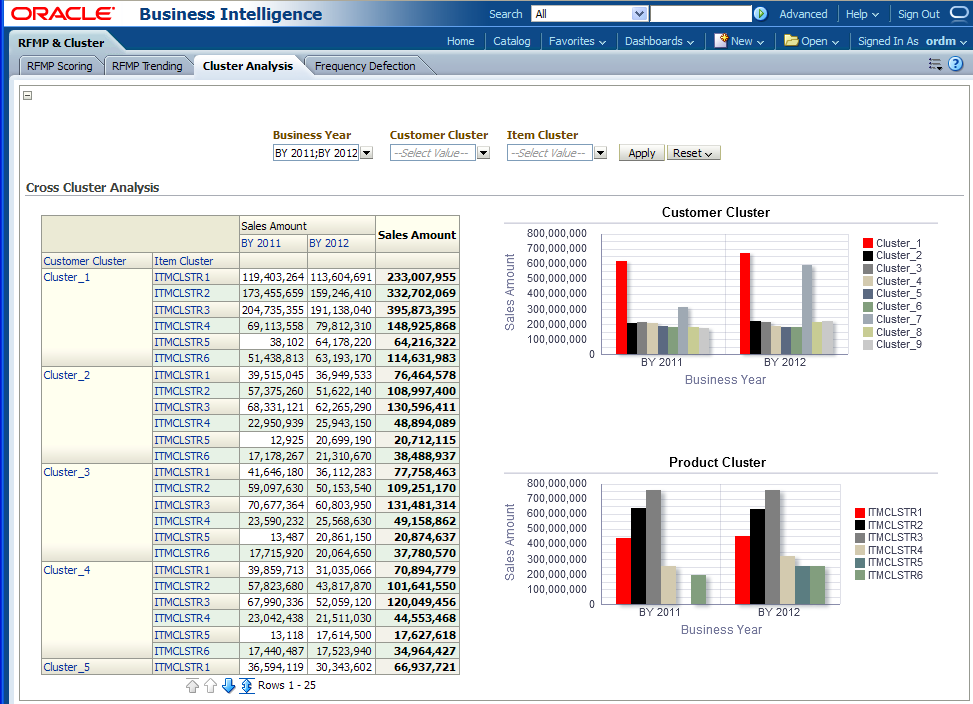
This report, as shown in Figure 12-8 provides sales and time information by customer cluster and product cluster.
Report dimensions are:
Business Time
Customer
Product
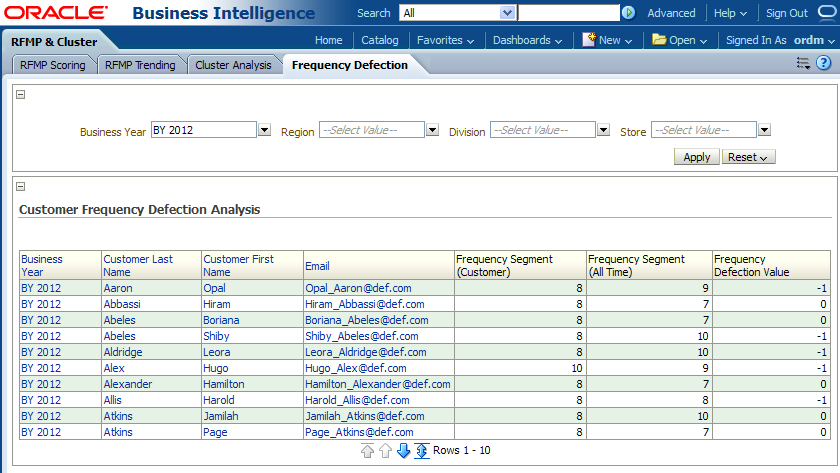
Figure 12-9 provides customer information for those at risk of defection based on frequency segment. The end user can view a list of frequency detection value and frequency segment of customers.
Report dimensions are:
Business Time
Customer
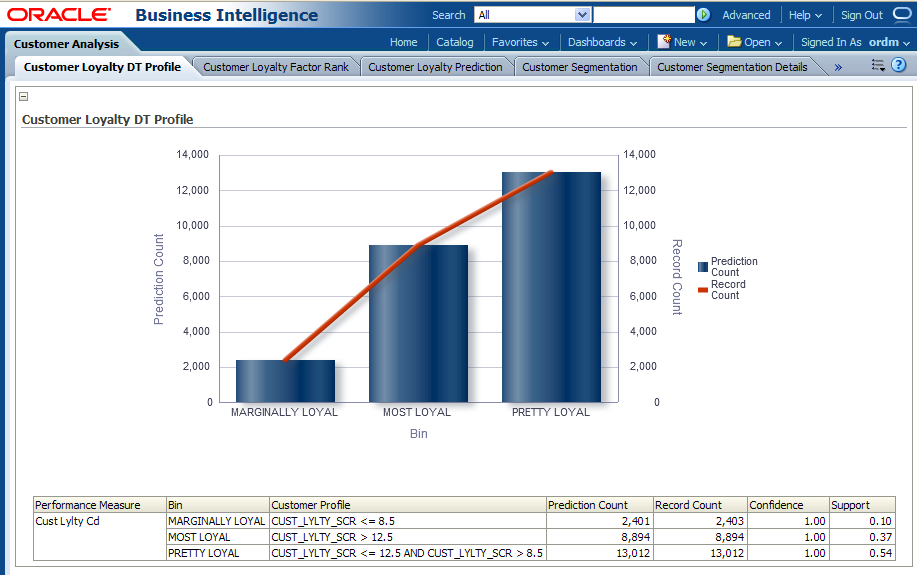
The customer analysis area includes the following reports: Customer Loyalty DT Profile, Customer Loyalty Factor Rank, Customer Loyalty Prediction, Customer Segmentation, and Customer Segmentation Details.
Figure 12-10 shows customer loyalty prediction Value Decision Tree rules generated by DT mining model (by DT).
Report dimensions are:
Business Time
Customer
Figure 12-11 provides customer information for customer loyalty analysis with attribute ranking with SVM Factors.
Report dimensions are:
Business Time
Customer
Figure 12-11 Customer Loyalty Factor Rank
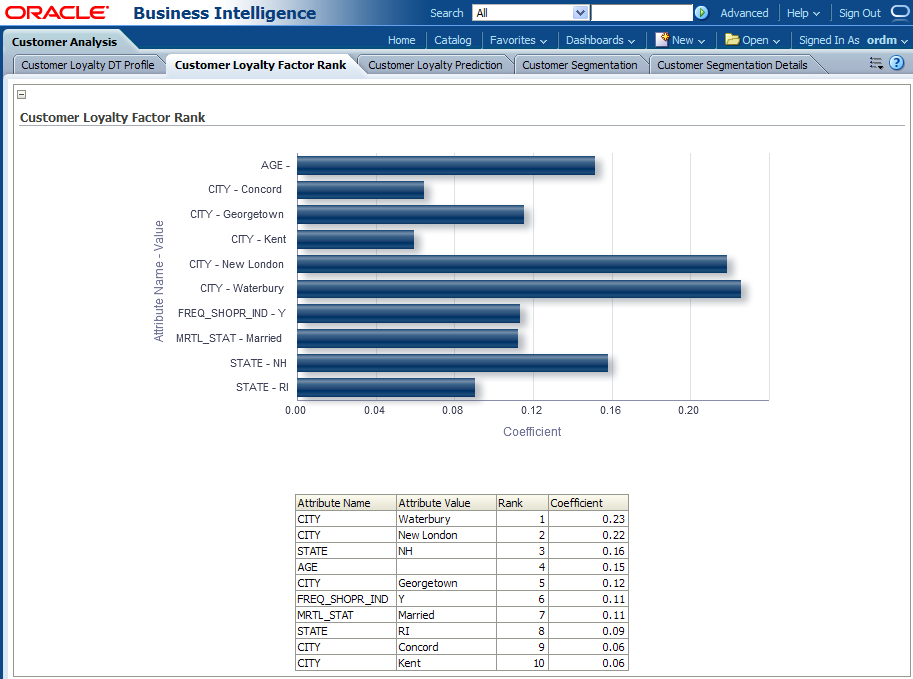
Figure 12-12 shows customer loyalty prediction (by SVM and DT).
Report dimensions are:
Business Time
Customer
Figure 12-12 Customer Loyalty Prediction Report
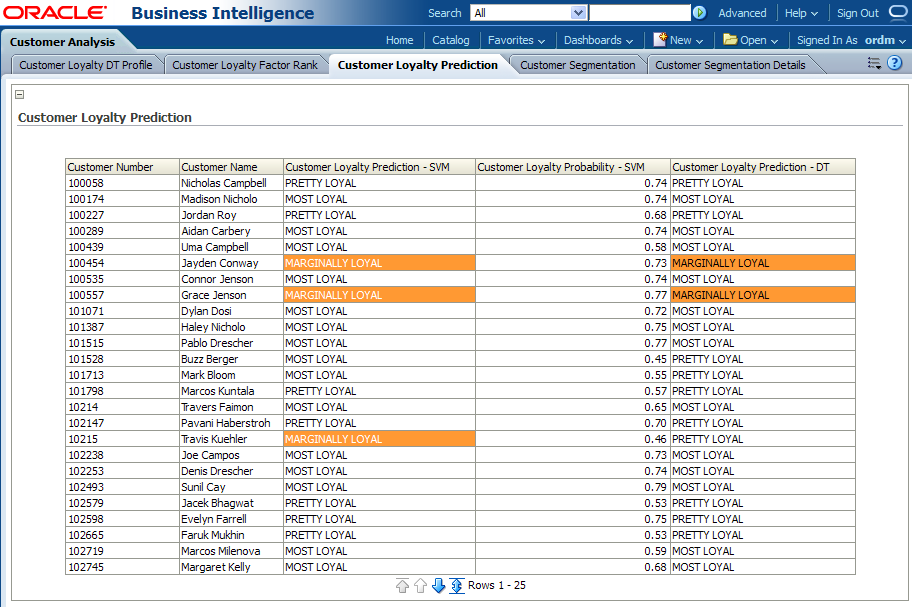
Figure 12-13 provides This report provides segment analysis of customers.
Report dimensions are:
Business Time
Customer
Figure 12-13 Customer Segmentation Report
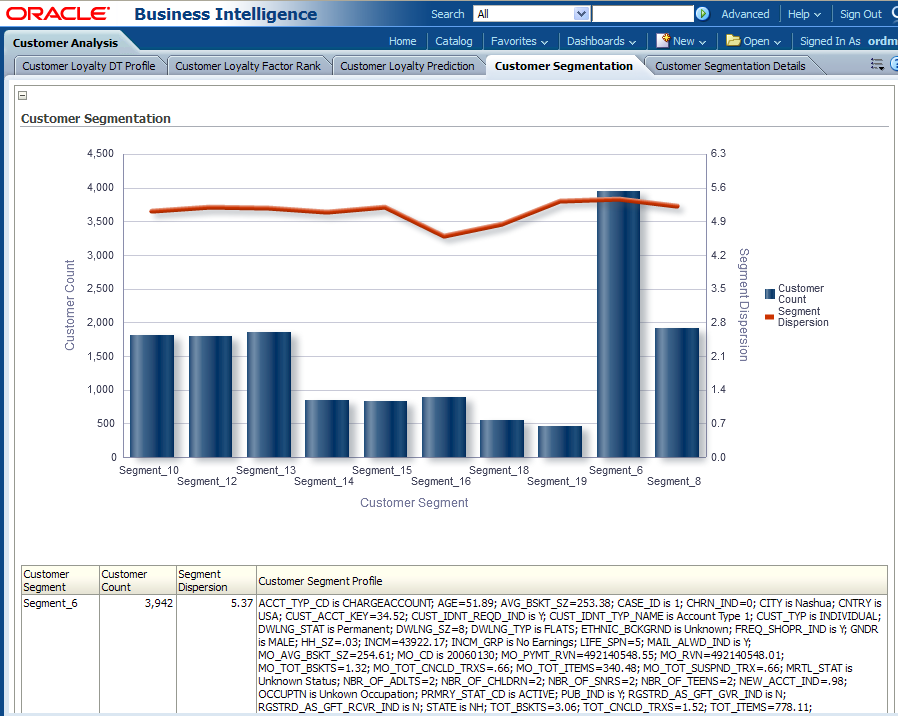
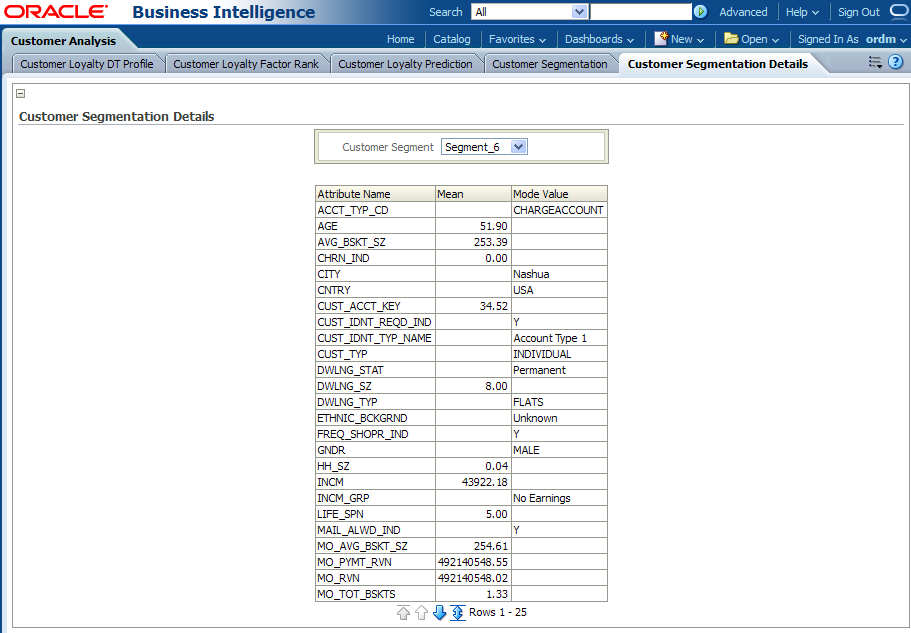
Figure 12-14 provides customer information by a selected segment.
Report dimensions are:
Business Time
Customer
Figure 12-14 Customer Segmentation Details Report
The promotion reports include the following:
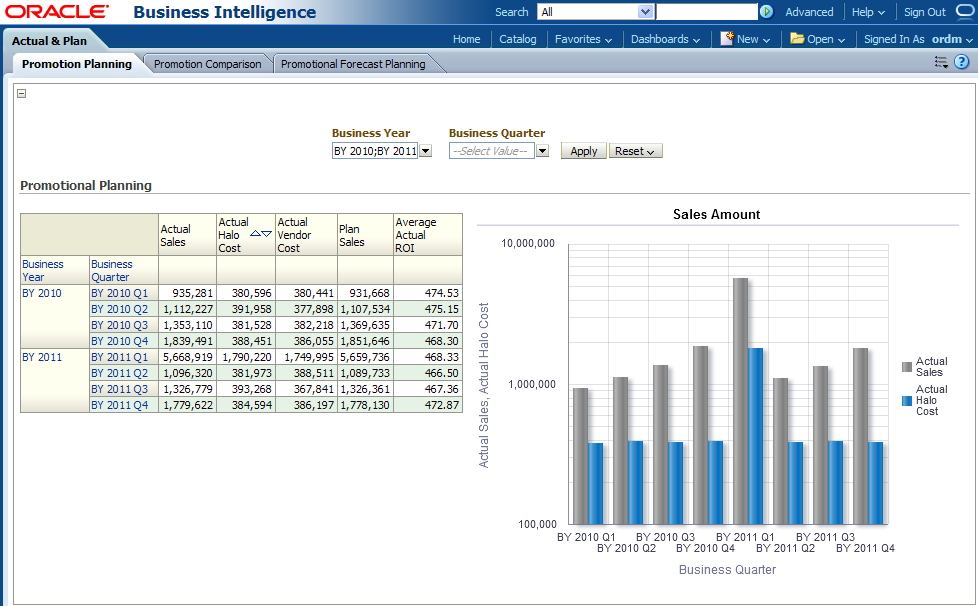
The actual and plan area includes the following reports: Promotion Planning, Promotion Comparison, and Promotional Forecast Planning.
Figure 12-15 provides promotion planning information.
Report dimensions are:
Business Time
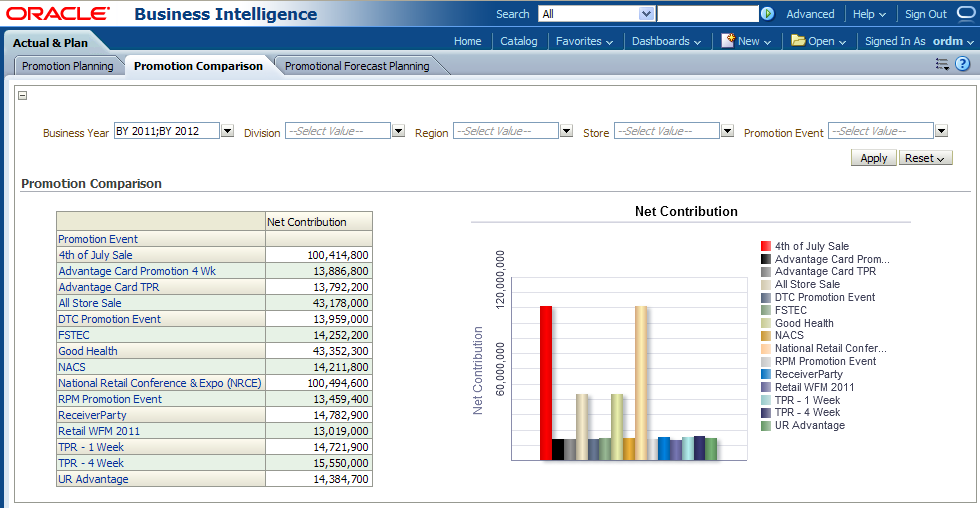
Figure 12-16 provides response rate information for customers in the target group, all of whom received promotion, by frequency segment.
Report dimensions are:
Business Time
Promotion
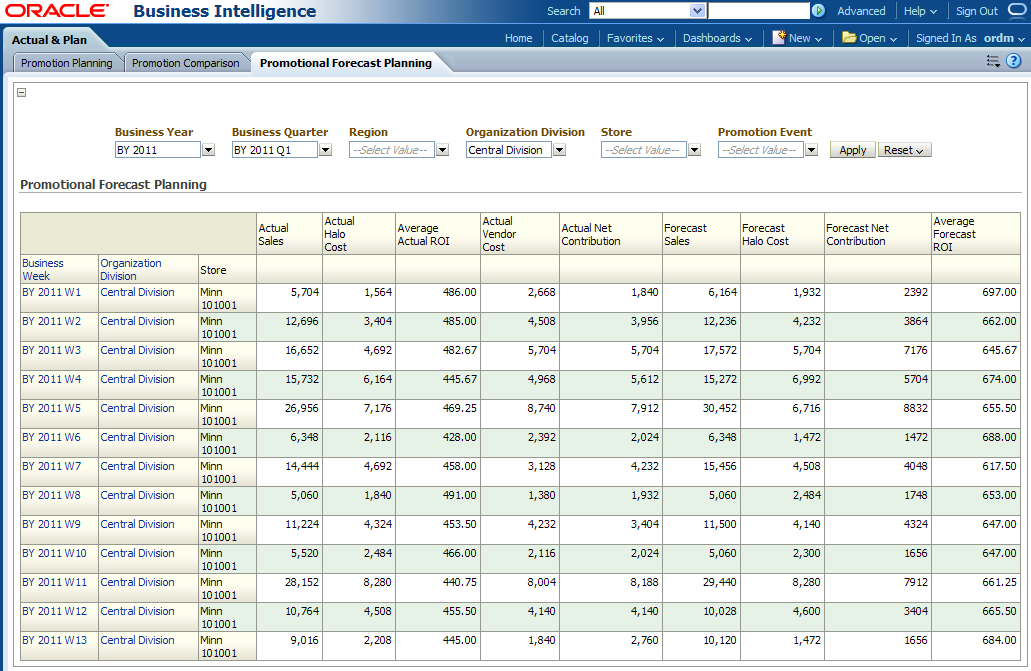
Figure 12-17 provides response rate information for customers in the target group, all of whom received promotion, by frequency segment.
Report dimensions are:
Business Time
Promotion
Figure 12-17 Promotional Forecast Planning
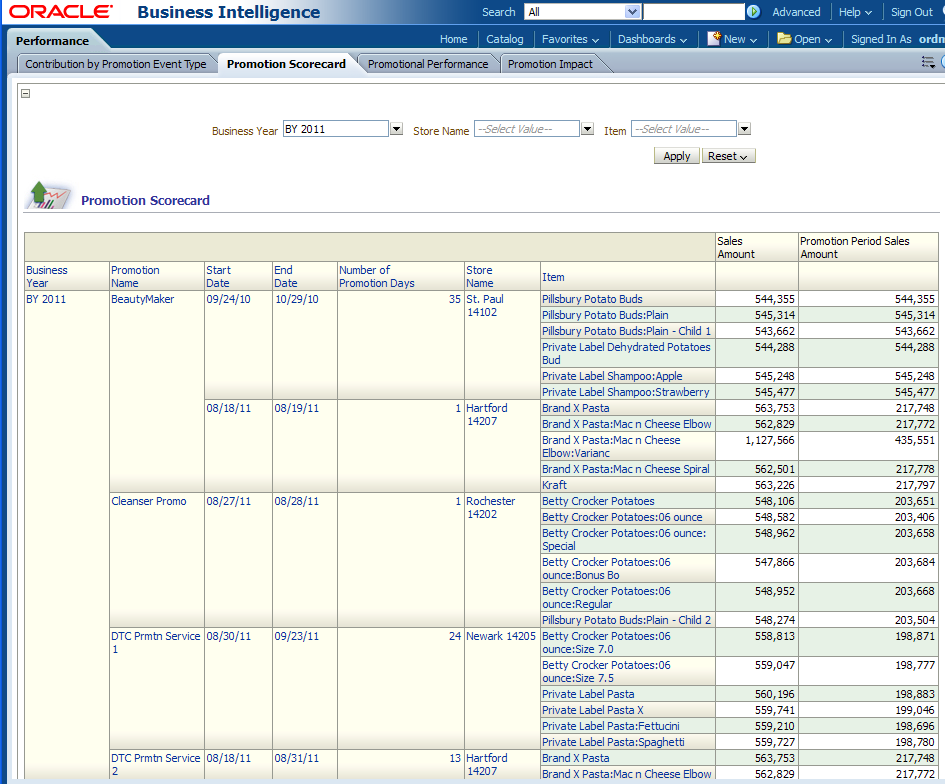
The performance area includes the following reports: Contribution by Promotion Event Type, Promotion Scorecard, Promotional Performance, and Promotion Impact.
Figure 12-18 provides response rate information for customers in the target group, all of whom received promotion, by frequency segment.
Report dimensions are:
Business Time
Organization
Promotion
Figure 12-18 Contribution by Promotion Event Type Store
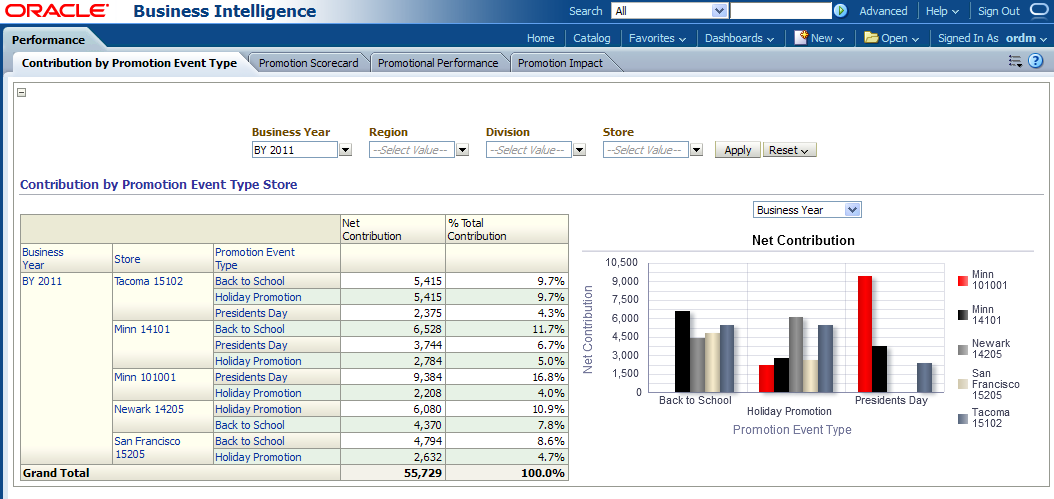
Figure 12-19 provides information on promotion sales and results.
Report dimensions are:
Business Time
Organization
Promotion
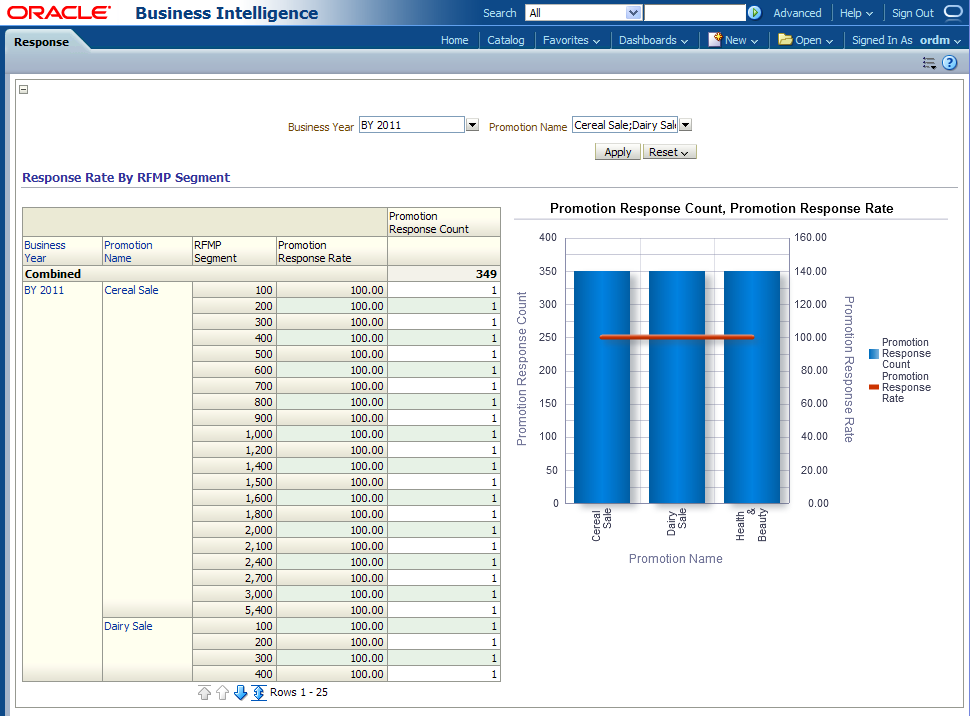
Figure 12-20 provides response rate information for customers in the target group, all of whom received promotion, by frequency segment.
Report dimensions are:
Business Time
Promotion
Figure 12-20 Promotional Performance Report
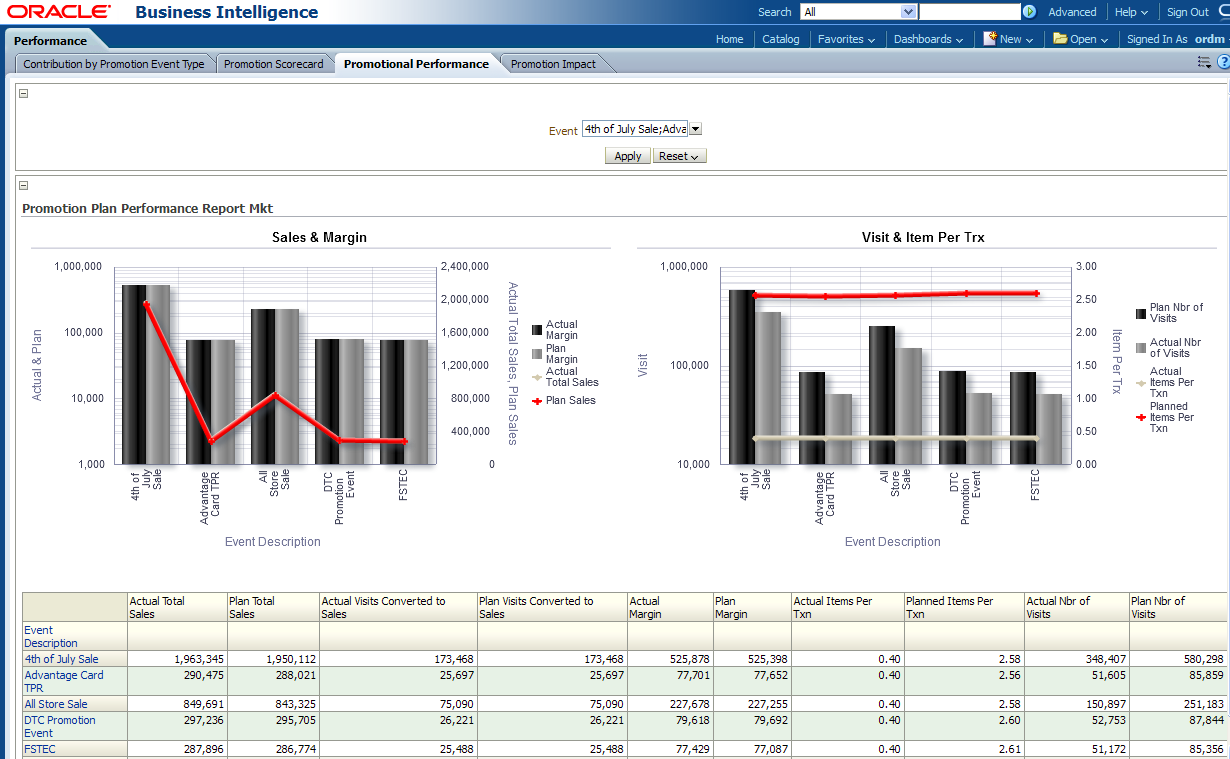
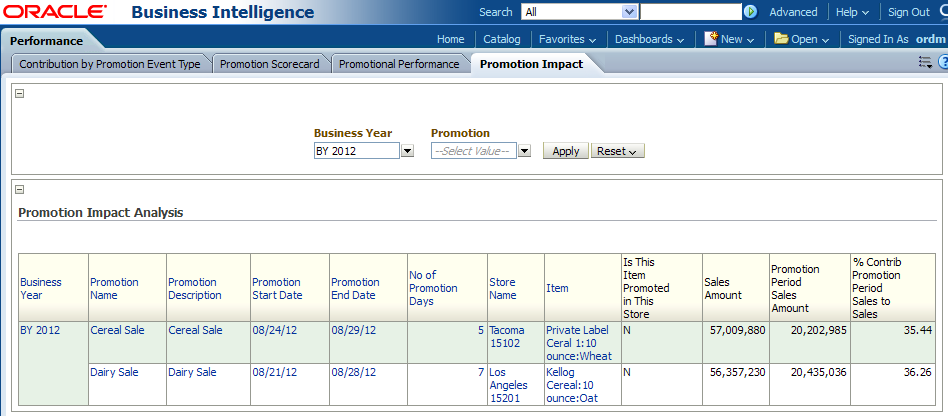
Figure 12-21 provides on promotion sales and results.
Report dimensions are:
Business Time
Promotion
Figure 12-22 provides response rate information for customers in the target group, all of whom received promotion, by frequency segment.
Report dimensions are:
Business Time
Promotion
The category reports include the following areas:
The contribution area includes the following reports: Scorecard, Item Profit on Cost, Pack Sales, Profit on Net Cost, Cost Trend, Class Item Level Profit.
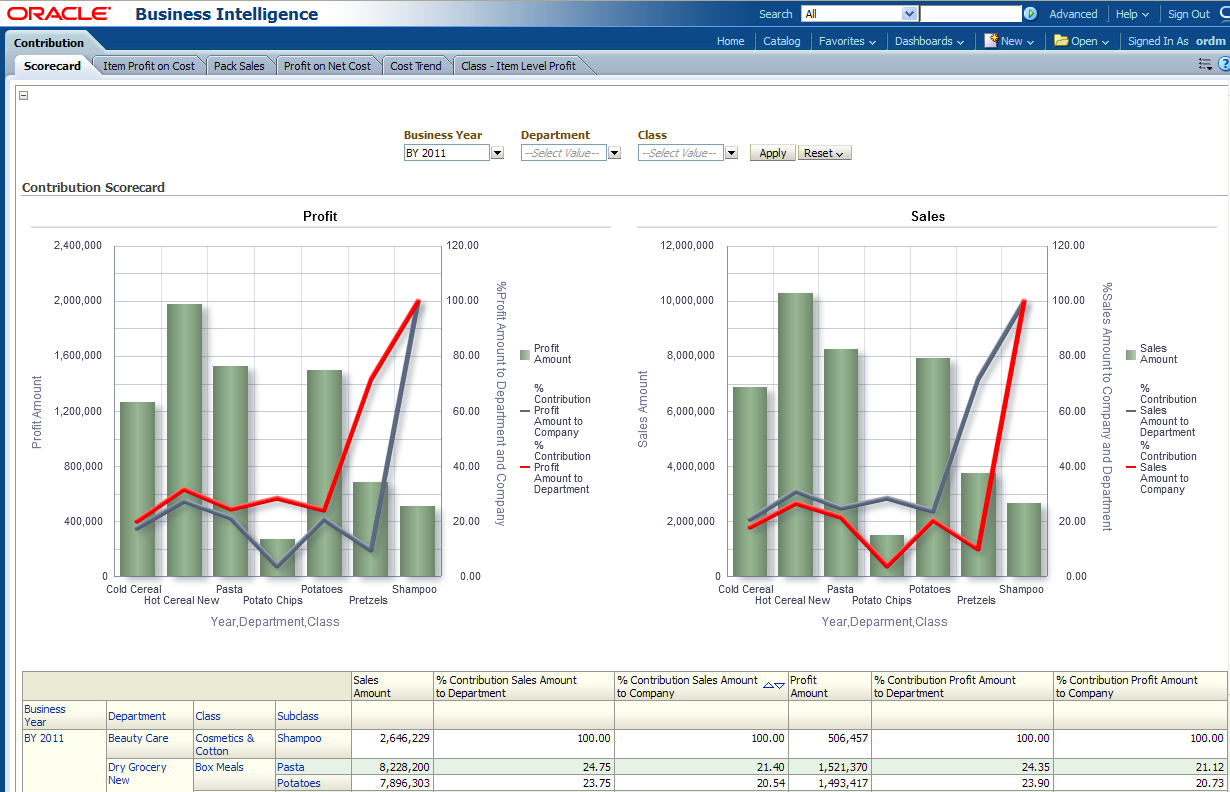
This report, as shown in Figure 12-23 provides sales contribution information based on department. The end user can compare last year compared to current year scorecard sales contribution for each department, class and subclass.
Report dimensions are:
Business Time
Product
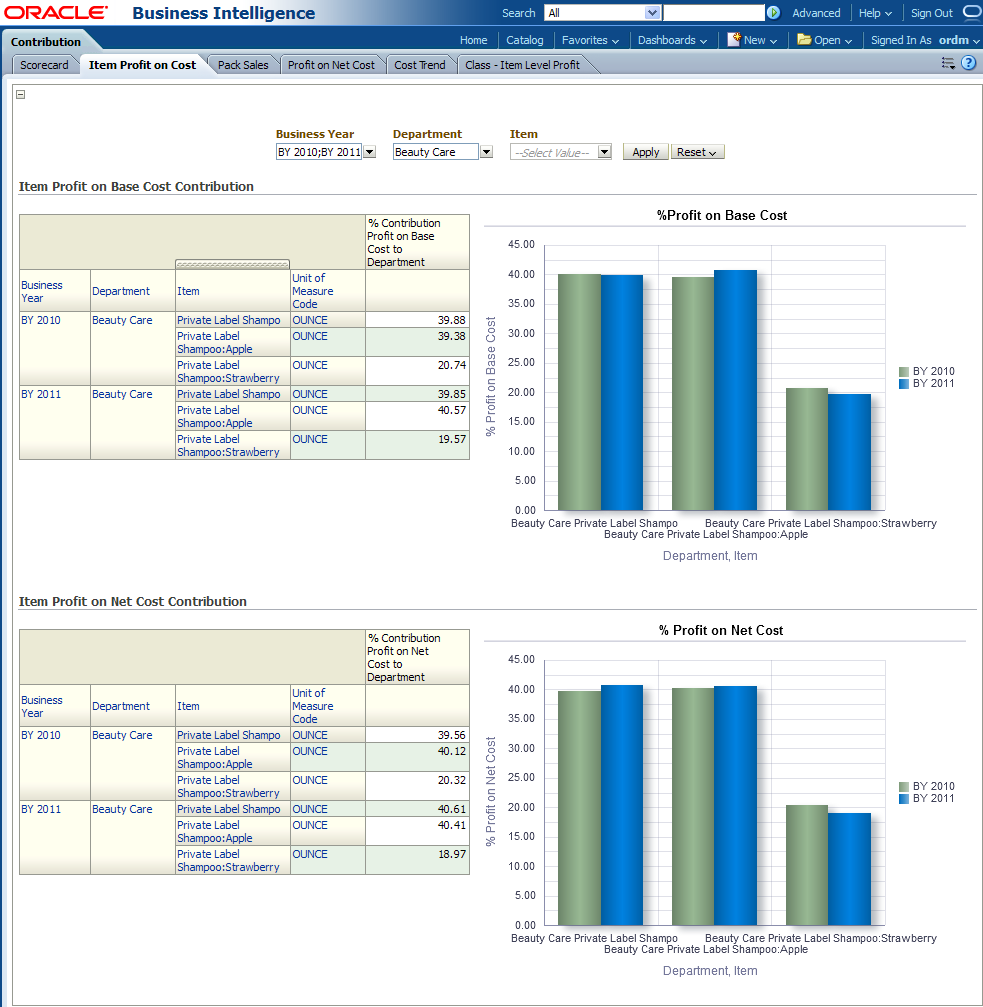
This report, as shown in Figure 12-24 provides item percent profit on base cost and net cost to department information. The end user can compare the %Contribution Profit on Base Cost and Net Cost of a department with last year's metrics.
Report dimensions are:
Business Time
Product
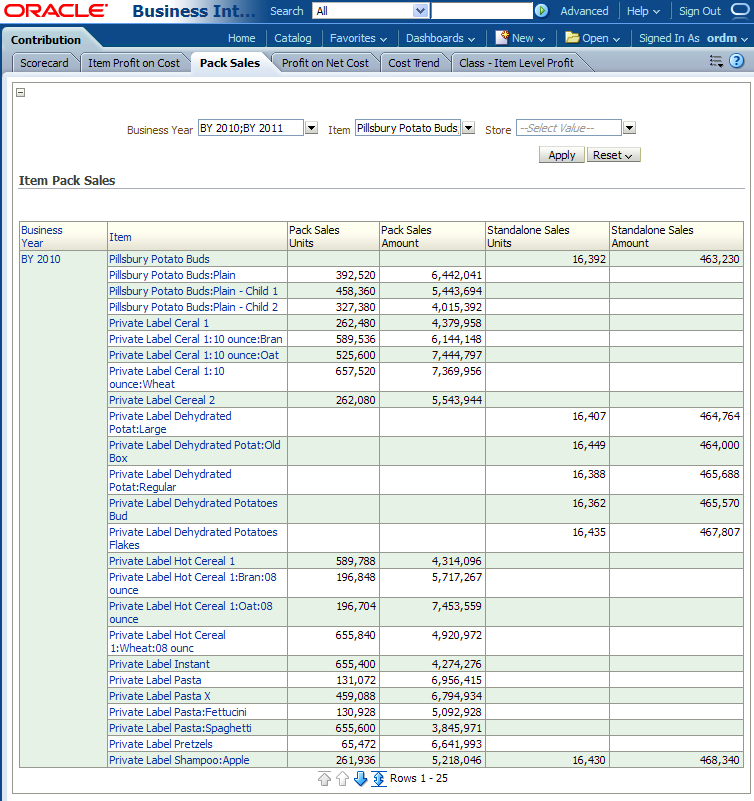
Figure 12-25 provides the yearly sales information of packaged items for each item.
Report dimensions are:
Business Time
Product
Organization
Figure 12-26 provides item percent profit on net cost information for each in a department. The end user can compare the %Profit Contribution on Net Cost for stores in a department with last year's metrics.
Report dimensions are:
Business Time
Product
Organization
Figure 12-26 Profit on net Cost Contribution Report
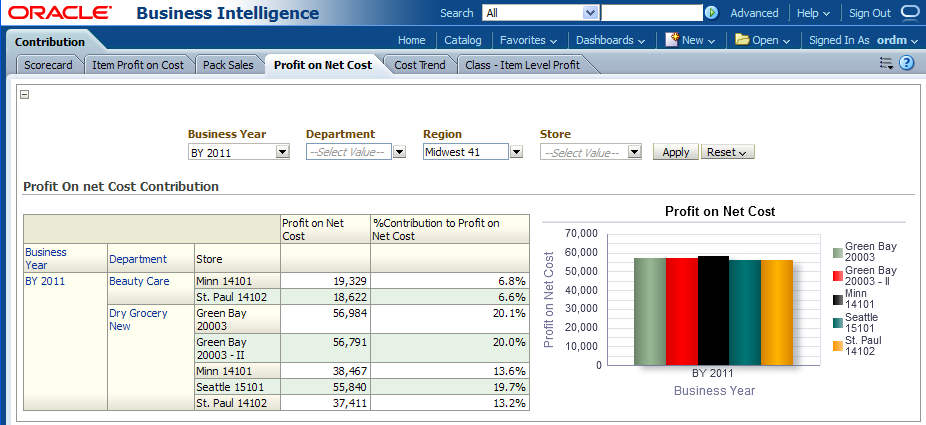
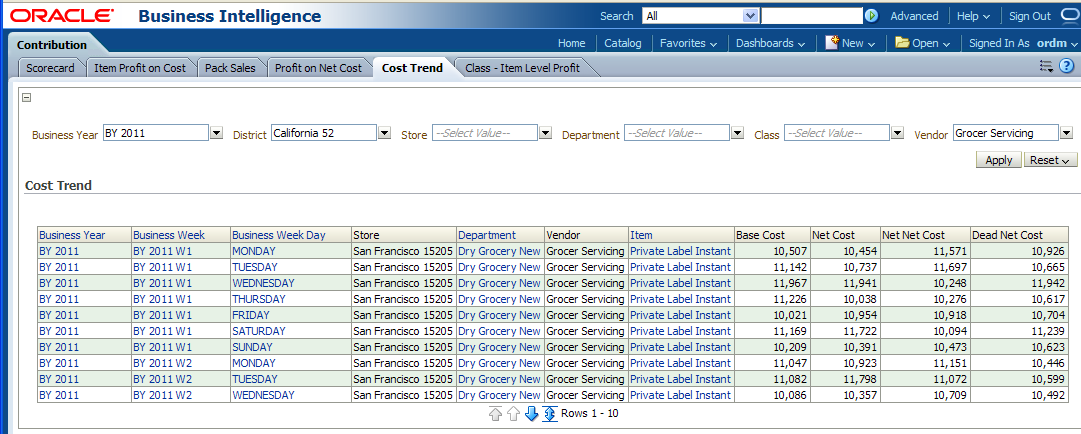
Figure 12-27 provides information on item to category sales and market sales contribution. The end user can see a list of %base cost, net cost, net-net cost and dead net cost for each item.
Report dimensions are:
Business Time
Product
Organization
Vendor
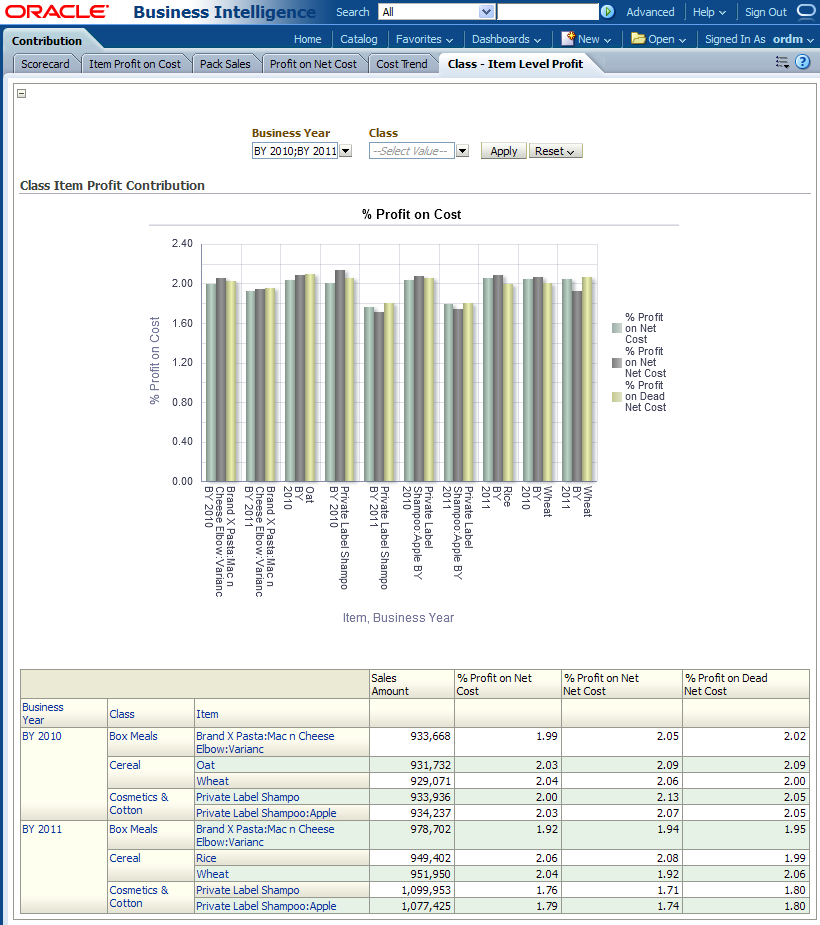
Figure 12-28 provides class-wise item level profit information. The end user can compare the %Profit on Net Cost, %Profit on Net-Net Cost and %Profit on Dead Net Cost for item in a class with last year's metrics.
Report dimensions are:
Business Time
Product
Figure 12-28 Class Item Level Profit Contribution Report
The performance area includes the following reports: Bottom Performance by Sales, Space Performance, Bottom Performance % Profit, Top Performance, and Top by Store.
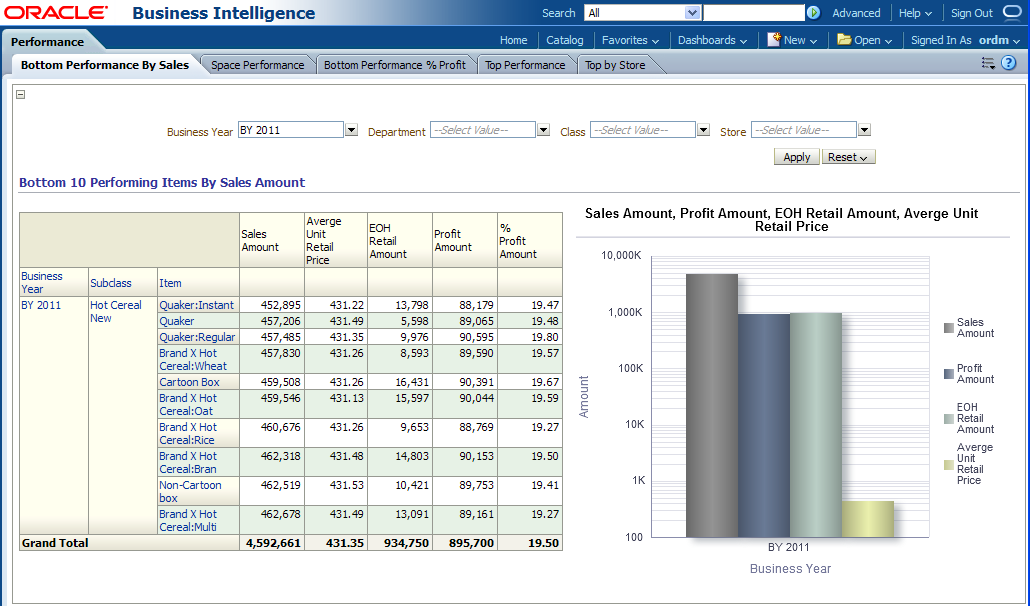
Figure 12-29 provides "Bottom 10 Performing Items By Sales Amount information for each year. The end user can compare EOH and BOH retail value and %Profit Amount for items with last year's metrics.
Report dimensions are:
Business Time
Product
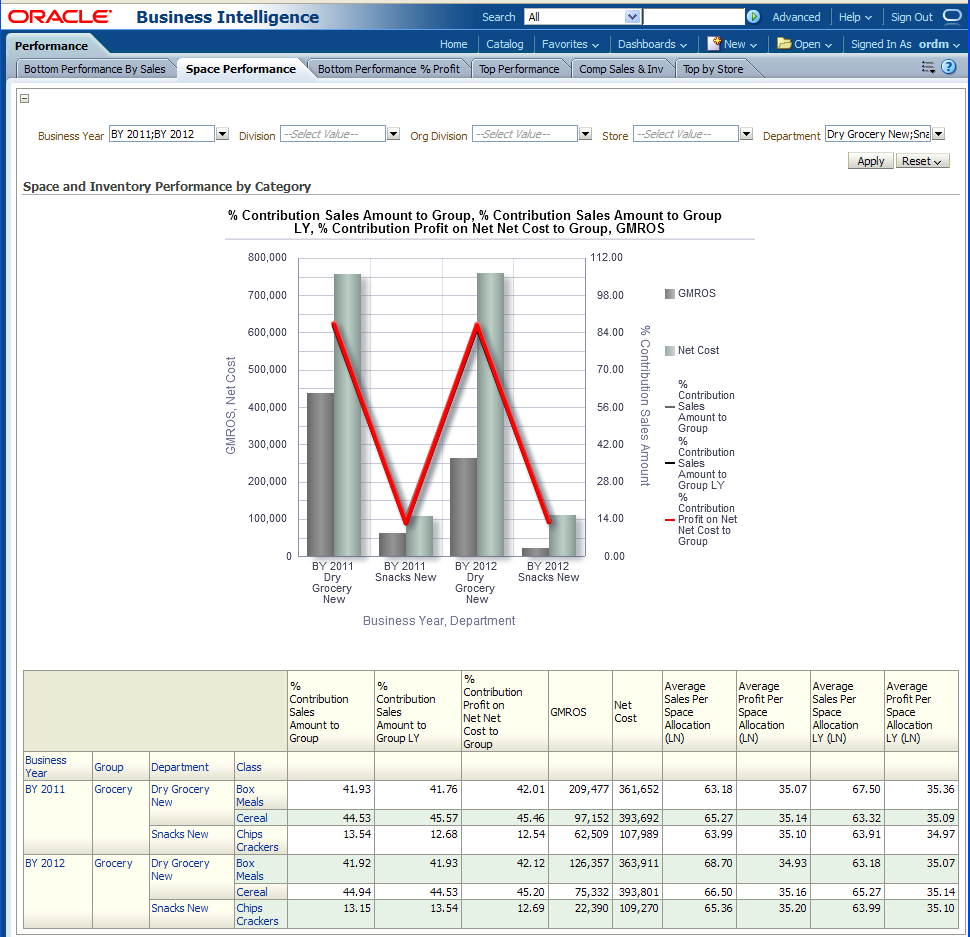
Figure 12-30 provides information on space allocation, sales, profit and contribution for items of current year compared to last year.
Report dimensions are:
Business Time
Product
Figure 12-31 provides "Bottom Performing Items By % Profit" information for each year. The end user can compare EOH and BOH retail value and %Profit Amount for items with last year's metrics.
Report dimensions are:
Business Time
Product
Figure 12-31 Bottom Performing Items by % Profit Report
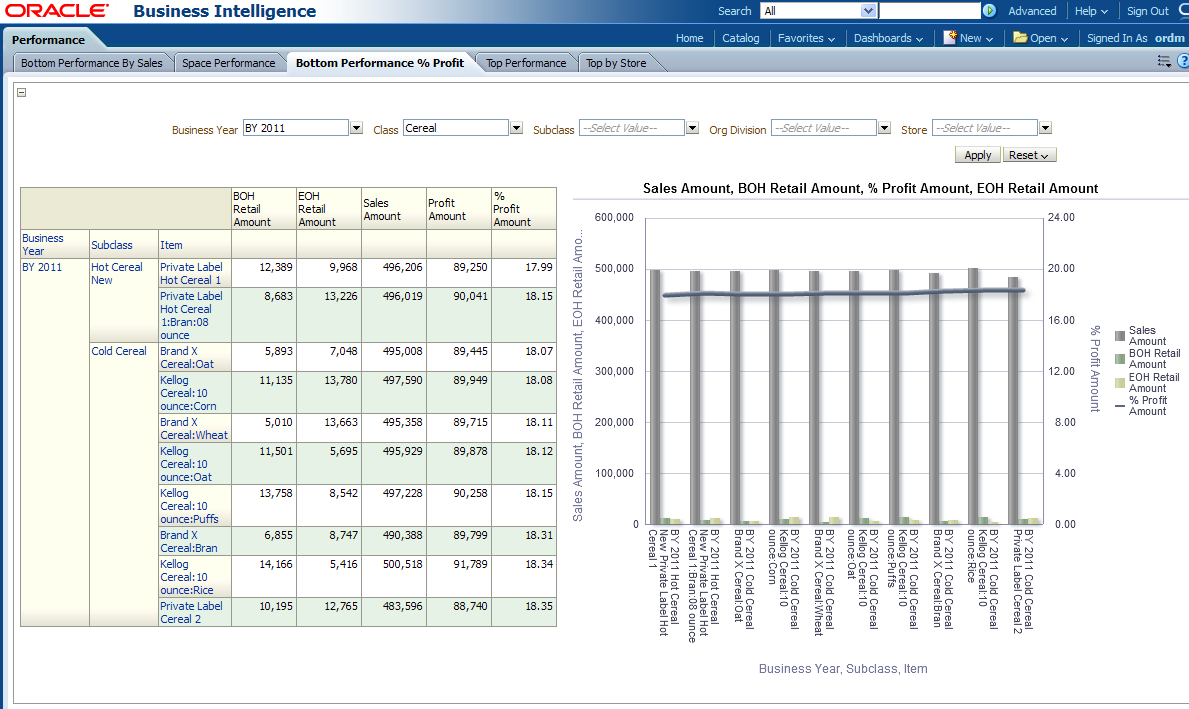
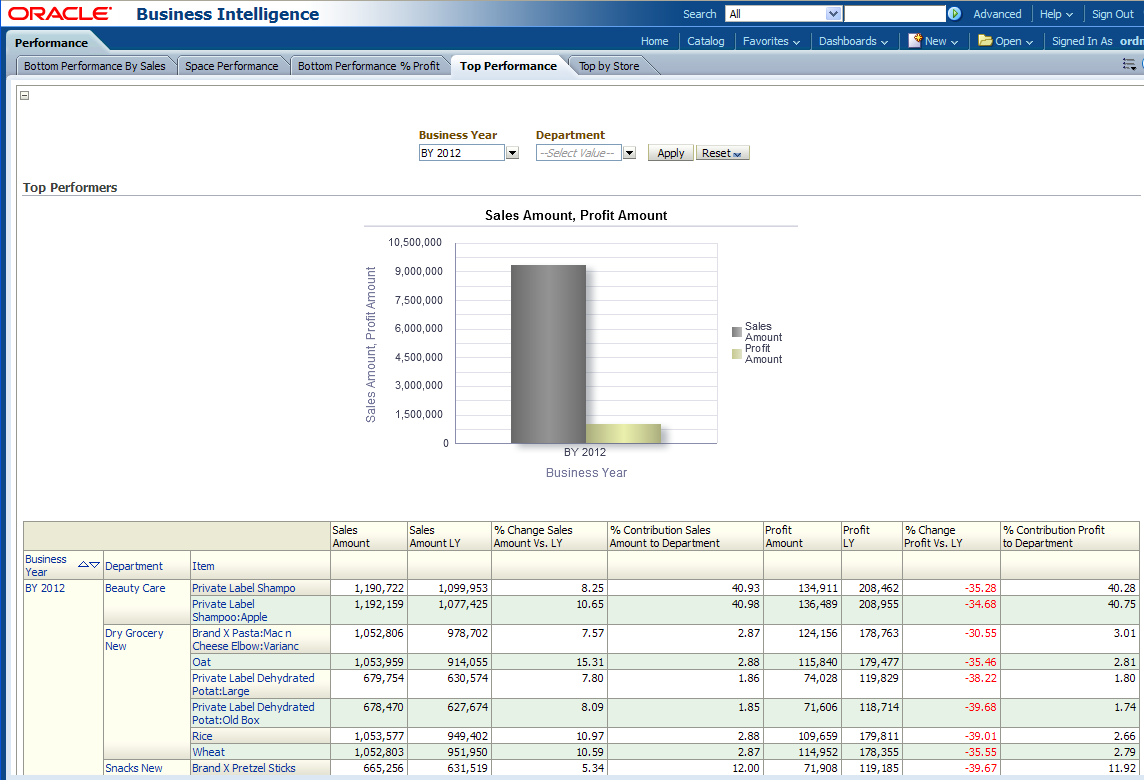
Figure 12-32 provides list of the top ten items based on sales. The information enables effective assortment efficiency and product positioning initiatives. The end user can compare the performer with last year's metrics such as: Sales Value, Sales Value LY, %Chg Sales Value Vs LY, Profit Amt, Profit Amt, Profit LY, %Contrib. Sales Value to Category, % Chg Profit Vs LY, %Contrib. Profit to Category.
Report dimensions are:
Business Time
Product
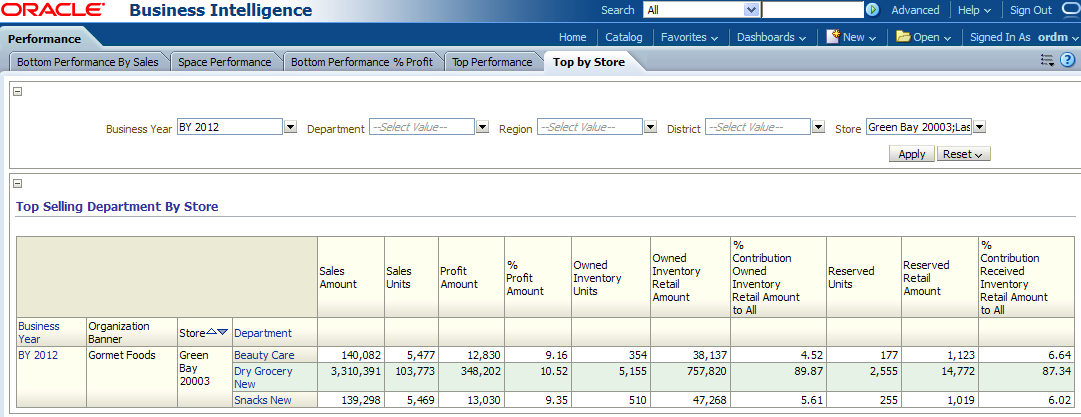
Figure 12-33 provides the top store performance.
Report dimensions are:
Business Time
Product
Figure 12-33 Top Selling Department by Store Report
The pricing area includes the following reports: Product Pricing and Organization Pricing.
Figure 12-34 provides pricing information based on sales, price, and inventory measures, by product.
Report dimensions are:
Business Time
Organization
Figure 12-34 Product Pricing Detail Report
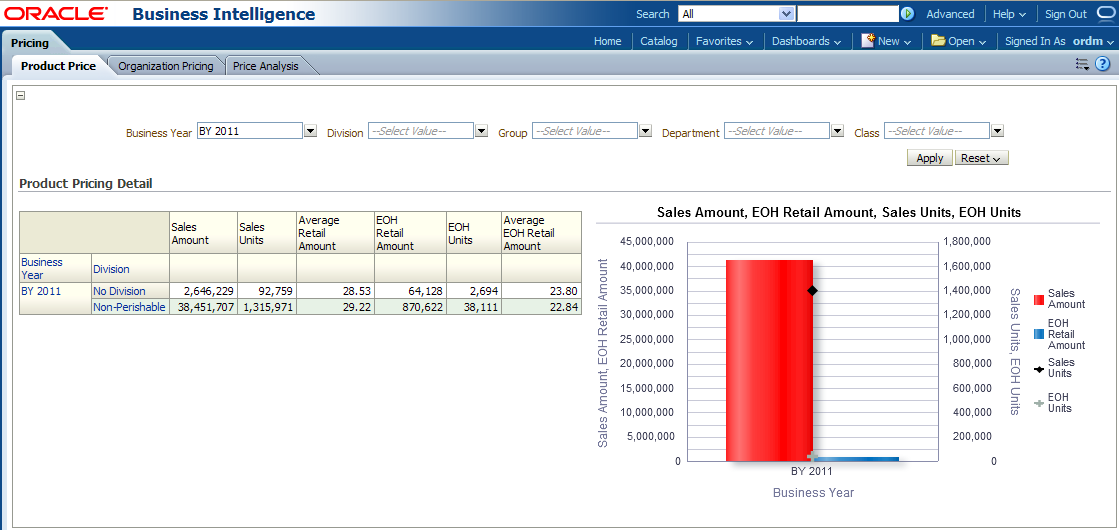
Figure 12-35 provides pricing information based on sales, price and inventory measures, by organization.
Report dimensions are:
Business Time
Organization
Figure 12-35 Organization Pricing Detail Report
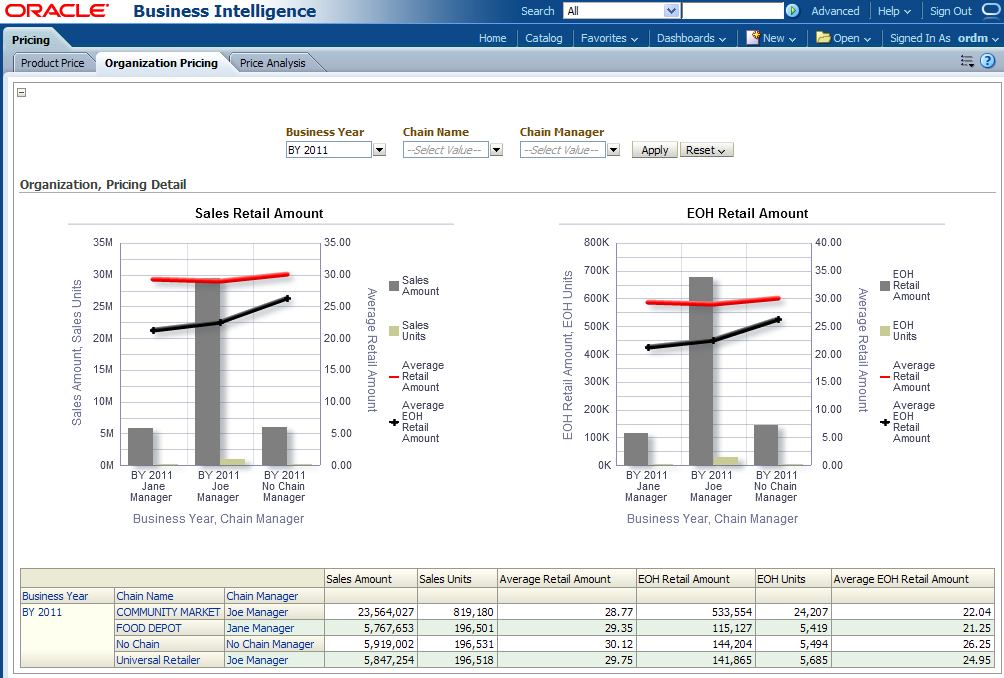
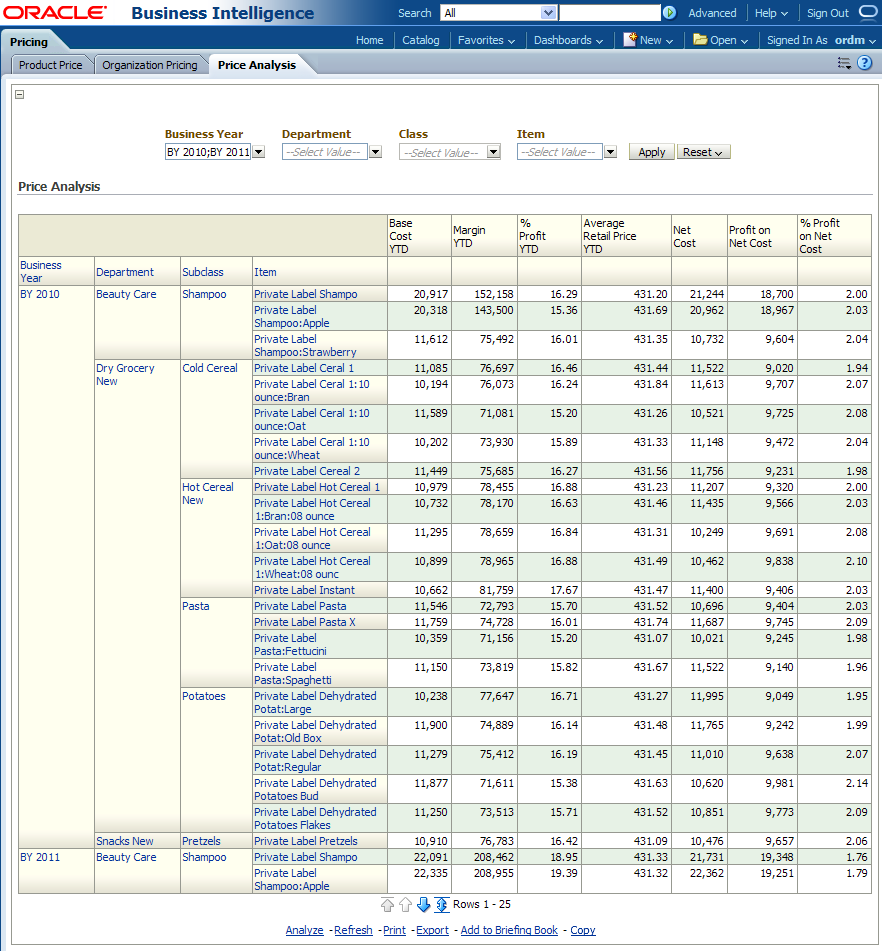
Figure 12-36 provides price analysis information. The report enables comparison of product pricing for stores and items.
Report dimensions are:
Business Time
Product
The product analysis area includes the following reports: Sales by Banner, Listing (Bottom), Sales by Channel, and Listing by Category.
Figure 12-37 provides sales value organized by department and banner. The end user can compare the department, sales value and organization banner with last year's metrics.
Report dimensions are:
Business Time
Product
Organization
Figure 12-37 Department Sales By Banner Report
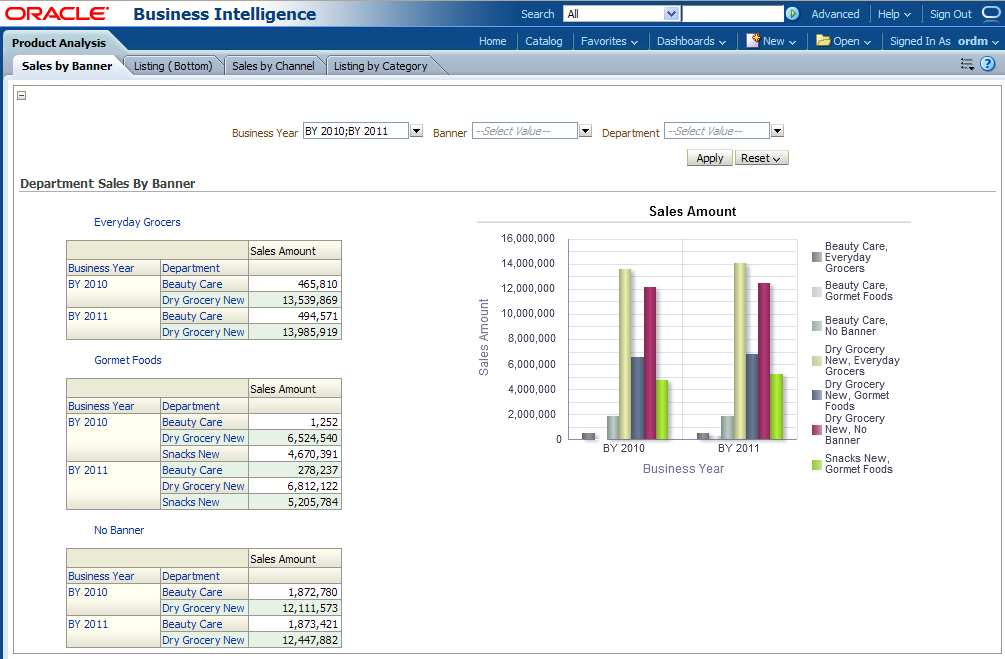
Figure 12-38 provides list of the bottom ten percent of items per category a retailer carries, based on sales value.
The end user can view a list of category-wise items, EOH units, no of days with stocks, sales value, sales value LY, %chg sales value compared to LY, % contrib. sales value to department, percent contrib. profit amt to department, profit amt, profit LY, %chg profit against LY, % contrib. profit amt department for a given year.
Report dimensions are:
Business Time
Product
Organization
Figure 12-38 Candidates for Delisting (Bottom 10% SV) Report
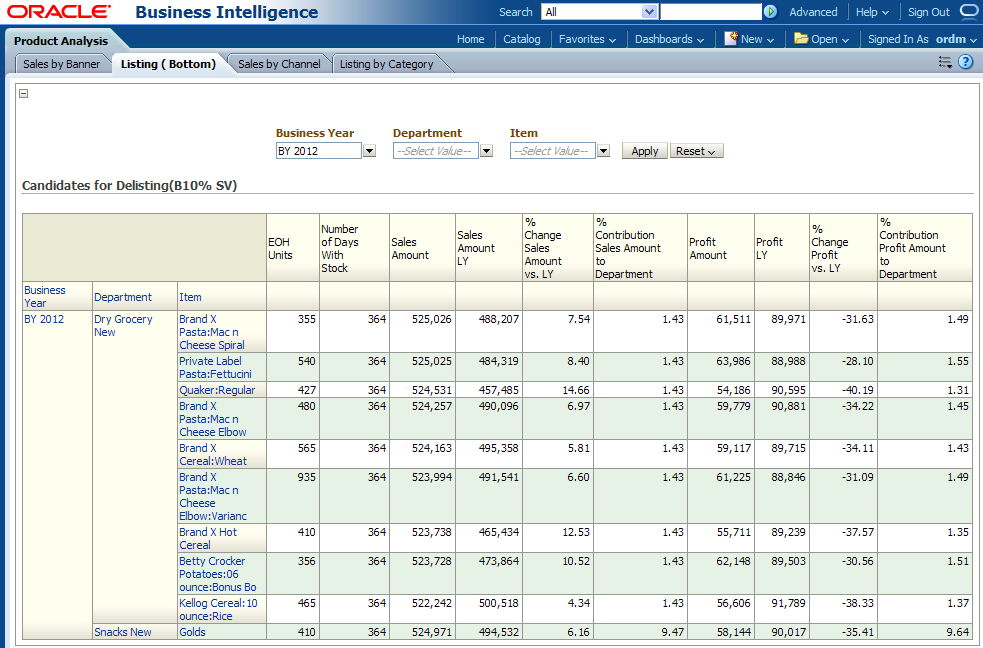
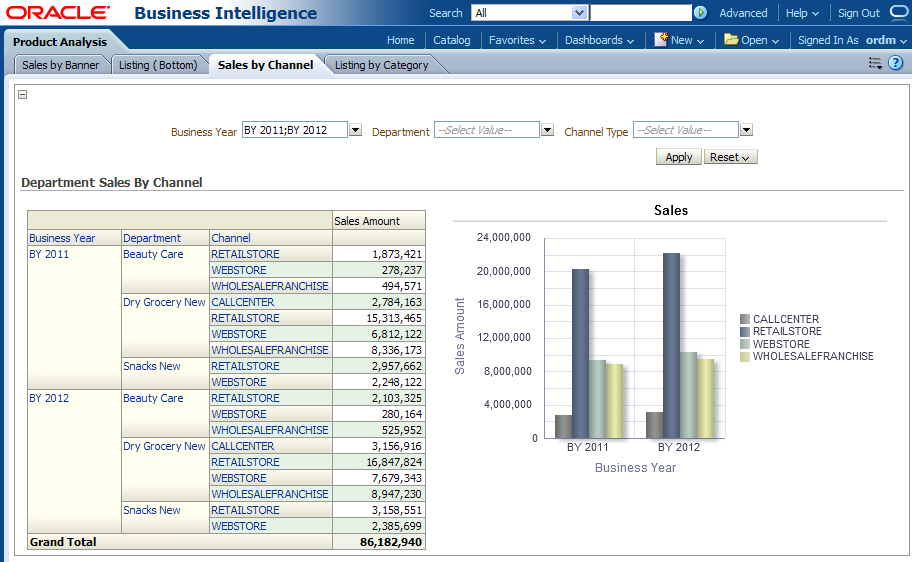
Figure 12-39 provides sales value information by department and channel. You can compare the sales values in lieu of channel type and department with last year's metrics.
Report dimensions are:
Business Time
Product
Channel Type
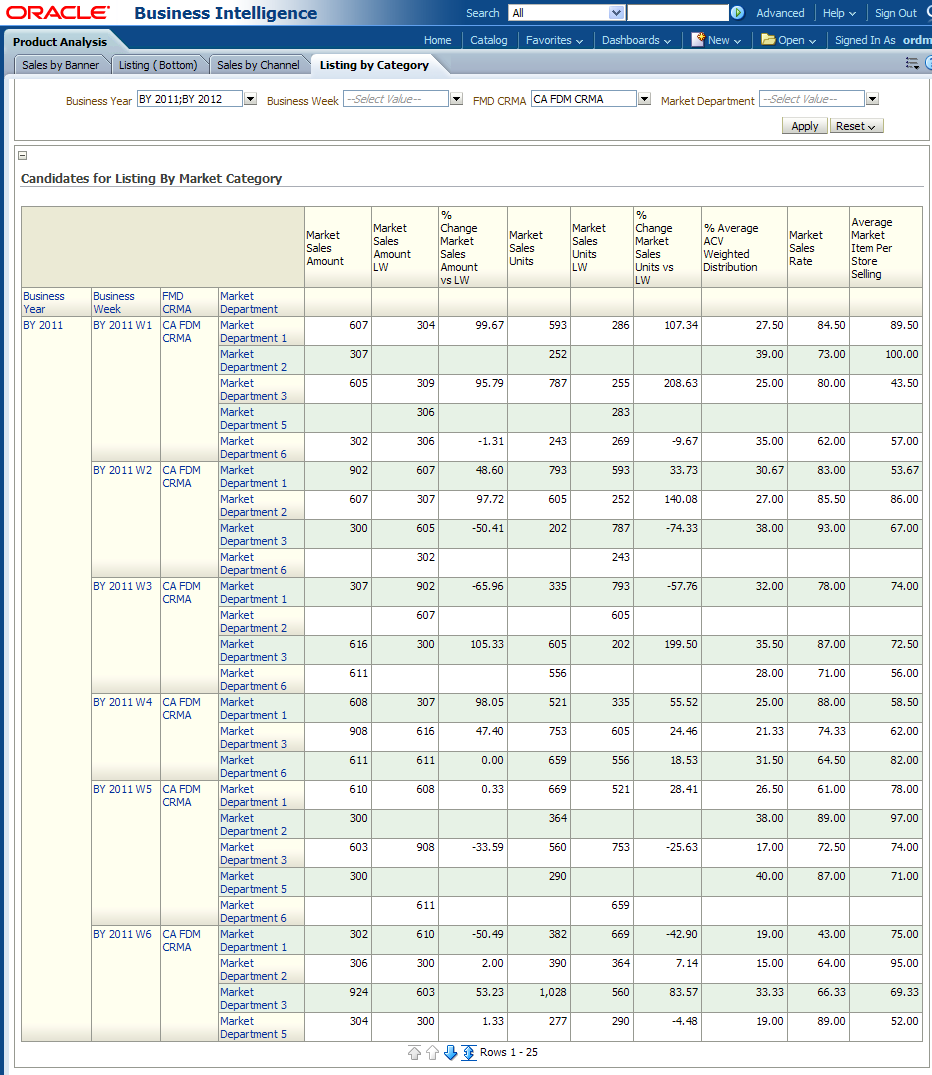
Figure 12-40 provides list of the bottom ten percent of items per category a retailer carries, based on sales value.
Report dimensions are:
Business Time
Product
Organization
The sales analysis area includes the following reports: Sales by Channel, Cross Sell Analysis, and Vendor Sales by Channel.
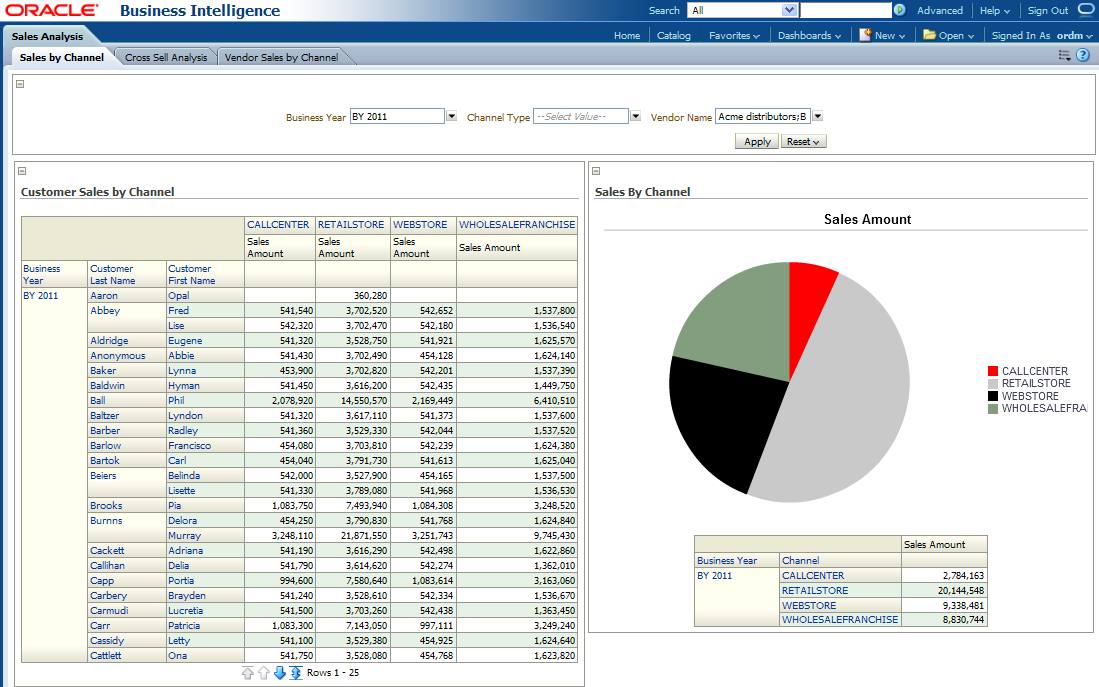
This report, as shown in Figure 12-41 provides sales information by channel. You can view a list of customer and sales value for each channel type for a business year.
Report dimensions are:
Business Time
Channel Type
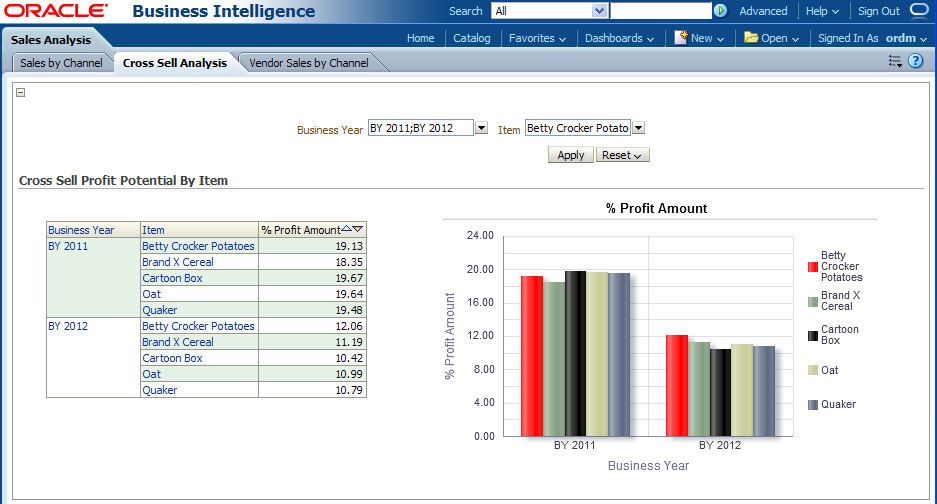
This report, as shown in Figure 12-42 provides potential of items that have affinity to the customer selected.
Report dimensions are:
Business Time
Product
Figure 12-42 Cross Sell Profit Potential by Item
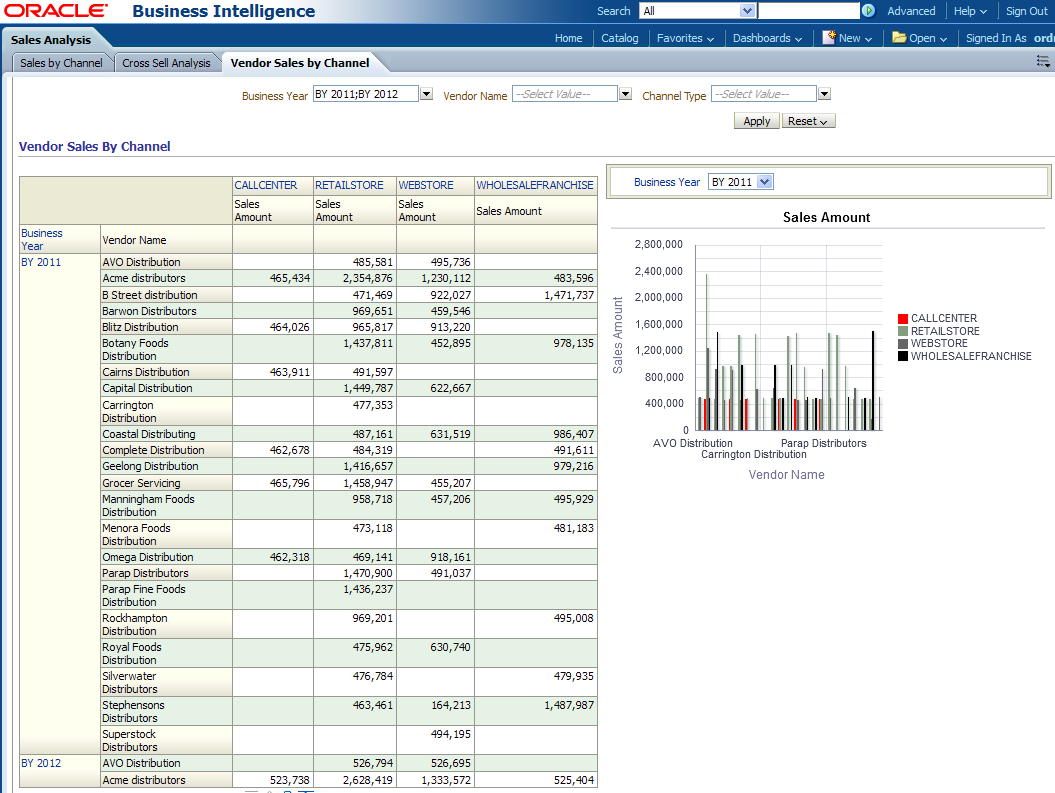
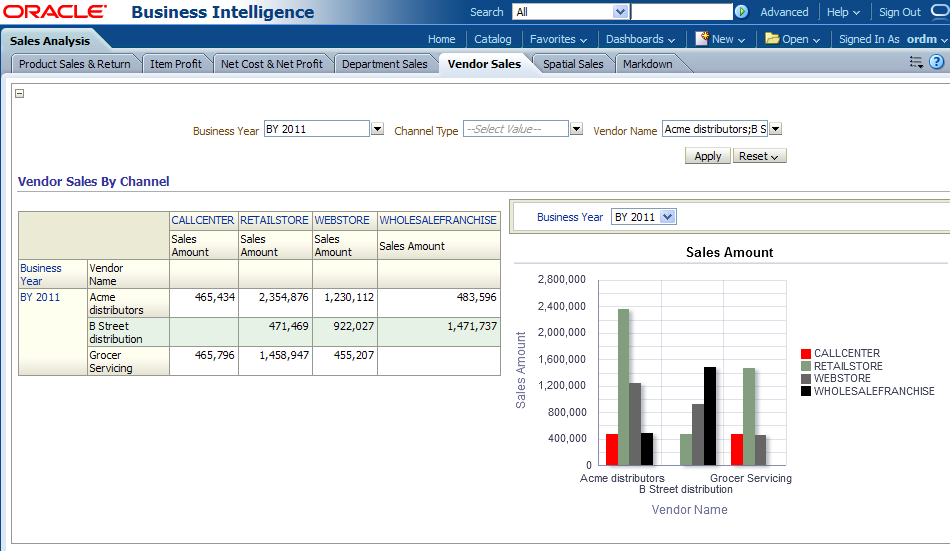
This report, as shown in Figure 12-43 provides vendor sales by channel information. The end user can compare vendor sales value for each channel type with last year's metrics.
Report dimensions are:
Business Time
Vendor
Channel Type
Figure 12-43 Vendor Sales by Channel Report
The sales and profit area includes the following reports: Gross Profit, Sales Profit Return by Channel (with store for local values), Sales Profit & Return by Channel, Sales Profit by Product Cluster, Product Cluster Sales and Profit, Sales & Profit by Customer Cluster, and Sales Profit & Return by Location Trait.
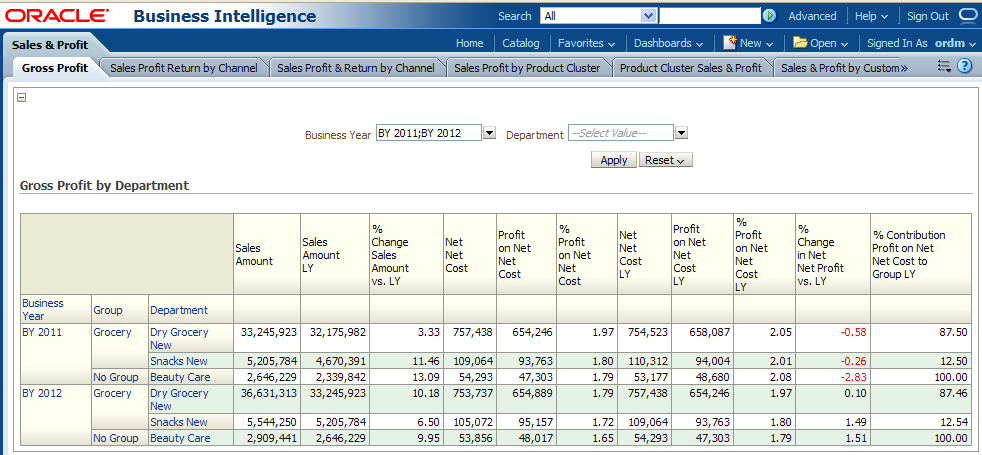
This report, as shown in Figure 12-44, provides "gross profit by department" information. The end user can compare the current year to the previous year profit on net-net cost measures at the item department level.
Report dimensions are:
Business Time
Product
Figure 12-44 Gross Profit by Department Report
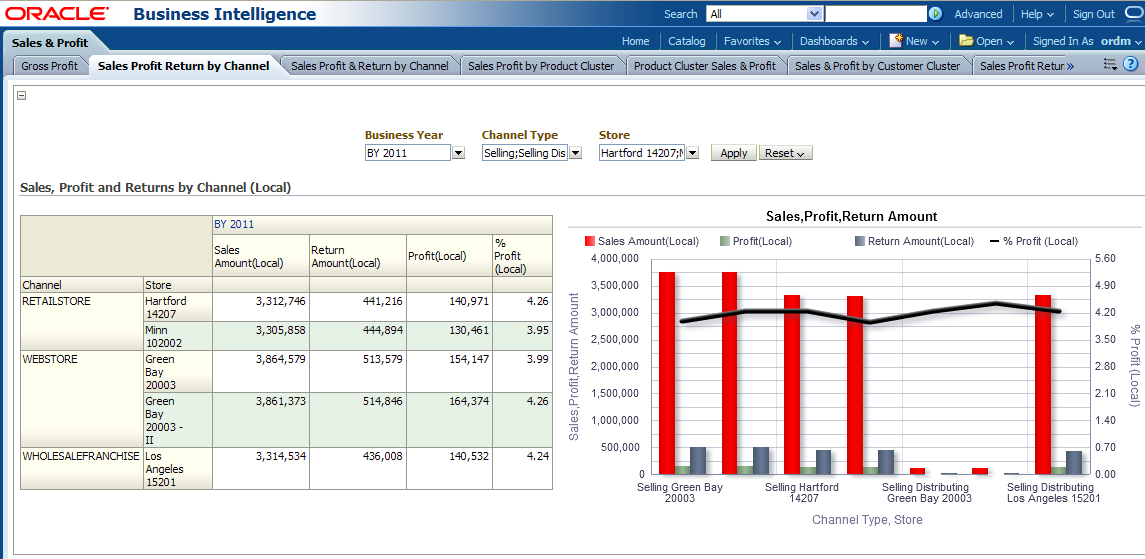
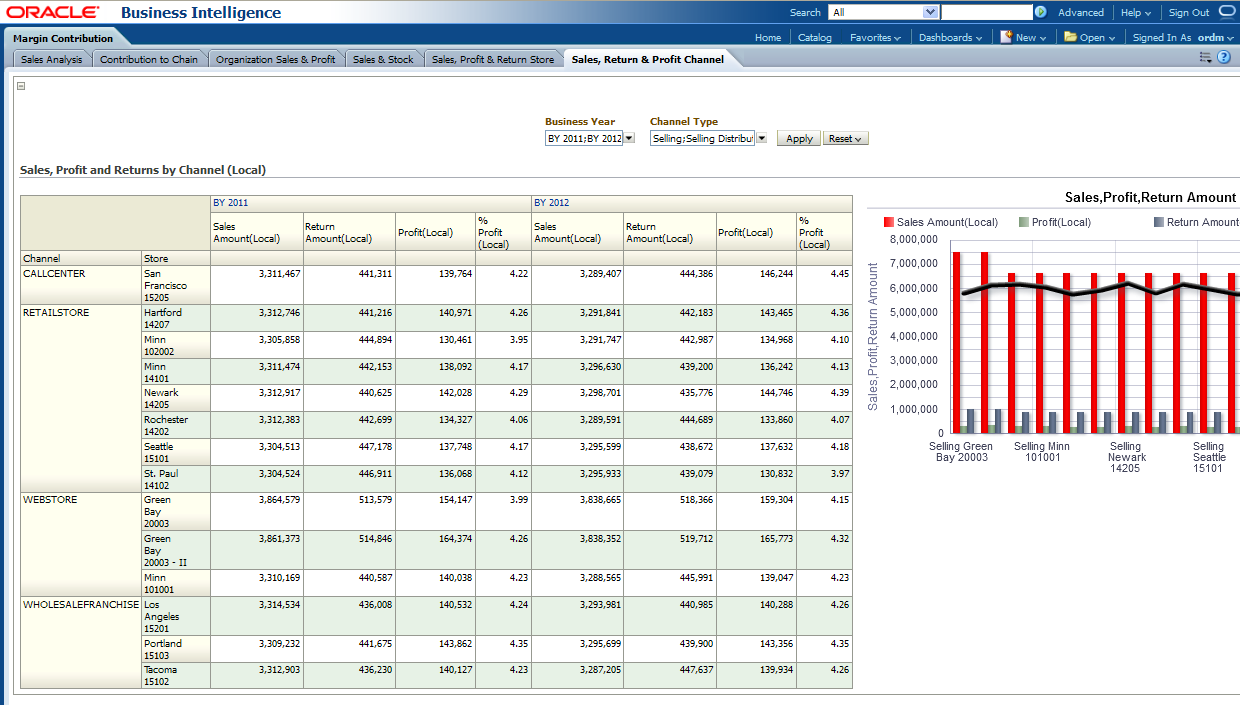
This report, as shown in Figure 12-45 provides sales, profit and returns information by channel. The end user can compare sales value, profit, %profit, return value for channel type and stores with last year's metrics.
Report dimensions are:
Business Time
Channel Type
Organization
Figure 12-45 Sales, Profit, and Returns by Channel (Local) Report
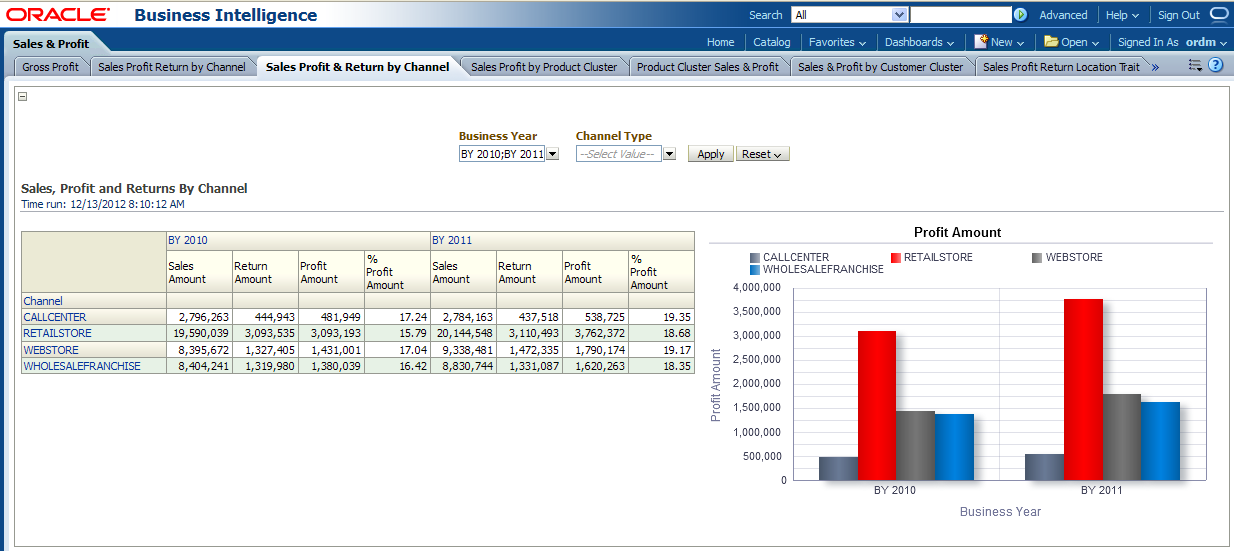
This report, as shown in Figure 12-46 provides sales, profit, and returns information by channel in local currency. The end user can compare sales value, profit amt, and return value, % profit amt for channel types with last year's metrics.
Report dimensions are:
Business Time
Channel Type
Figure 12-46 Sales, Profit and Returns by Channel Report
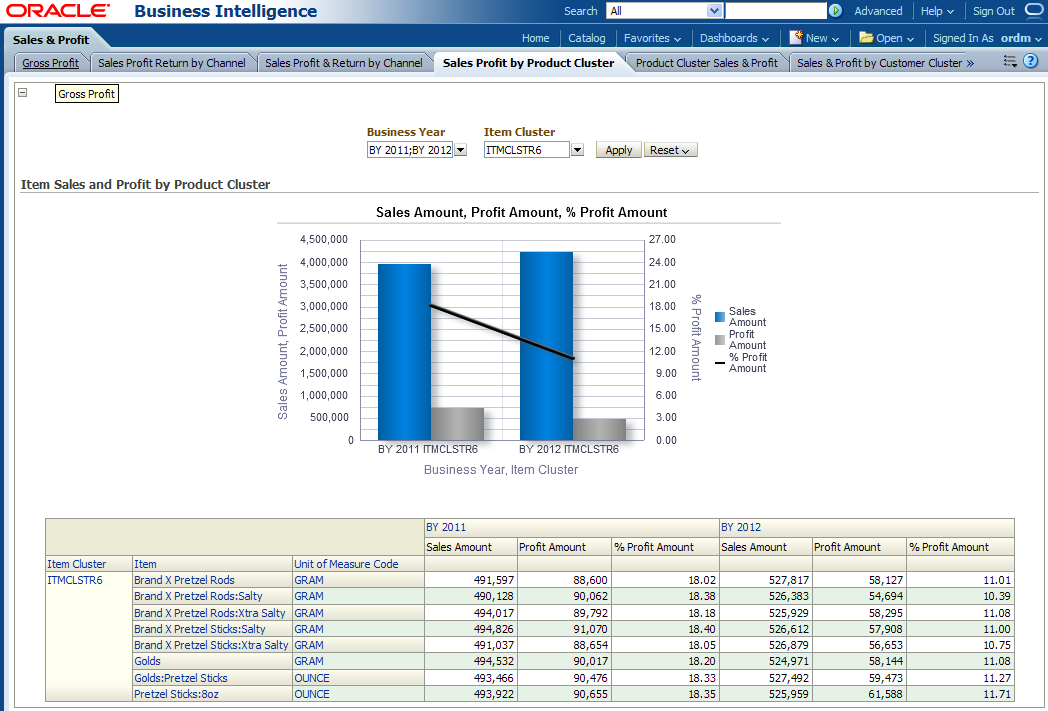
This report, as shown in Figure 12-47 provides sales and profit information by product cluster. The end user can view a list of sales value, profit amt, %profit amt for items in a product cluster.
Report dimensions are:
Business Time
Product
Figure 12-47 Item Sales and Profit by Product Cluster Report
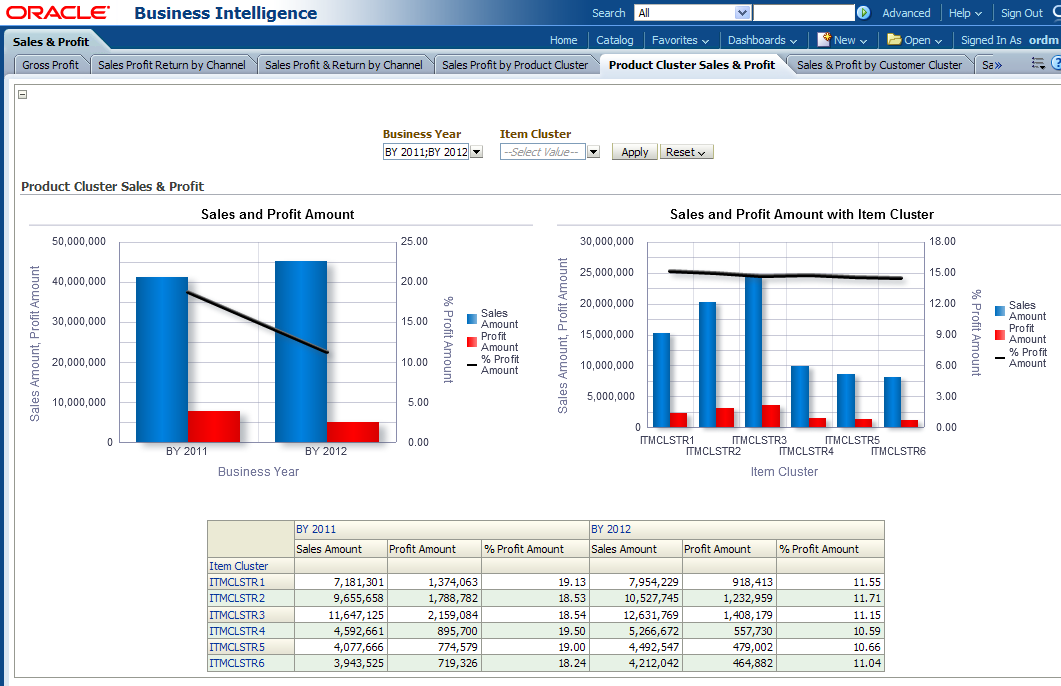
This report, as shown in Figure 12-48 provides sales and profit information by product cluster. The end user can view a list of sales value, profit amt, %profit amt for items in a product cluster.
Report dimensions are:
Business Time
Product
Figure 12-48 Product Cluster Sales & Profit Report
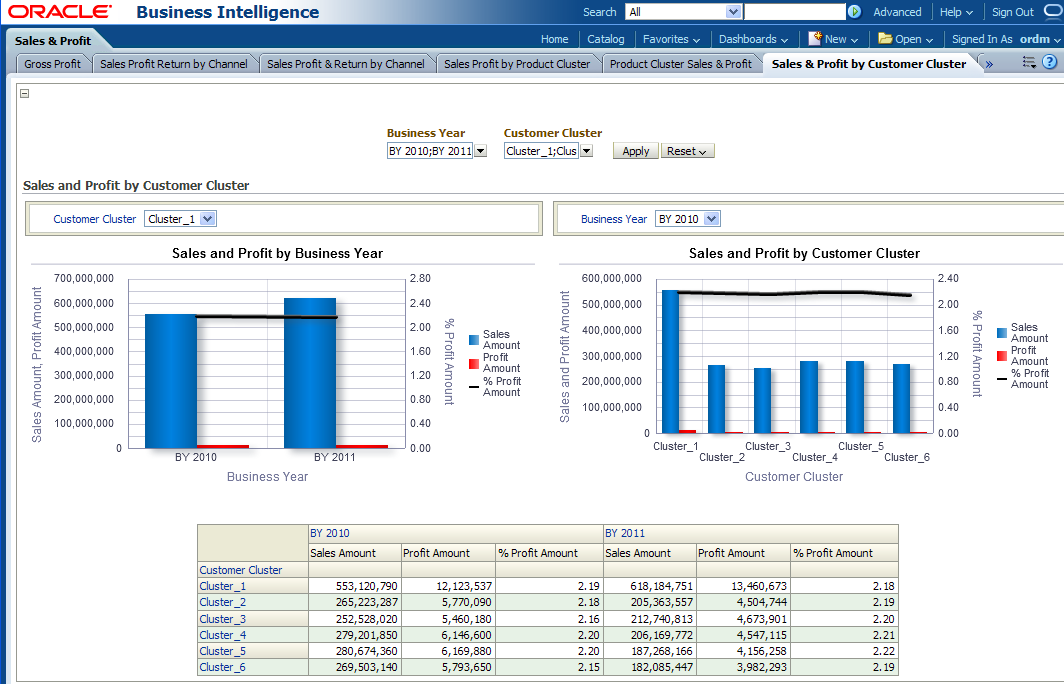
This report, as shown in Figure 12-49 provides sales and profit information by customer cluster and customer spending habits. The end user can compare sales value, profit amt and %profit amt for each customer cluster with last year's metrics.
Report dimensions are:
Business Time
Customer
Figure 12-49 Sales and Profit by Customer Cluster Report
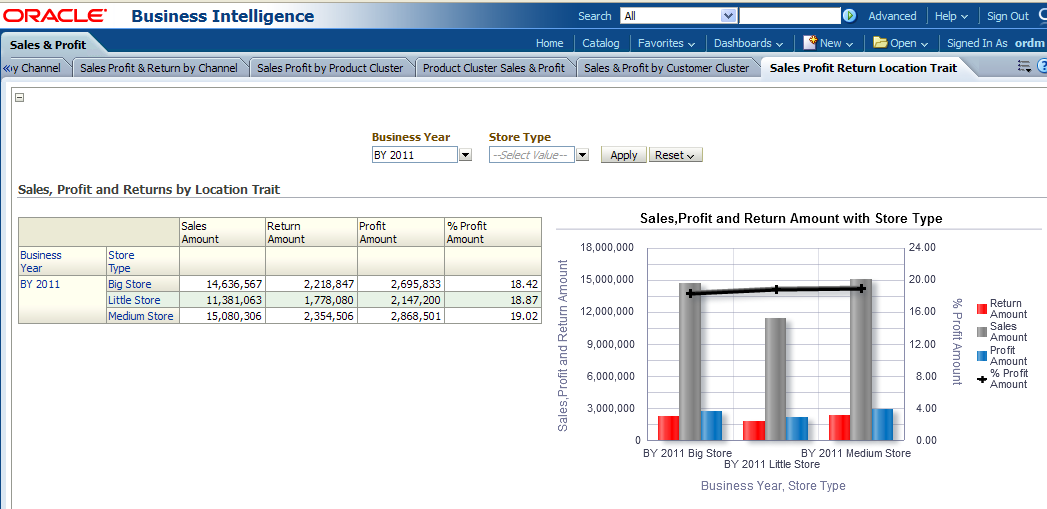
This report, as shown in Figure 12-50 provides sales, profit and returns information based on location trait. The end user can compare current year against last year sales value, profit amount, return value, %profit amt for the store types.
Report dimensions are:
Business Time
Organization
Figure 12-50 Sales Profit and Returns by Location Trait Report
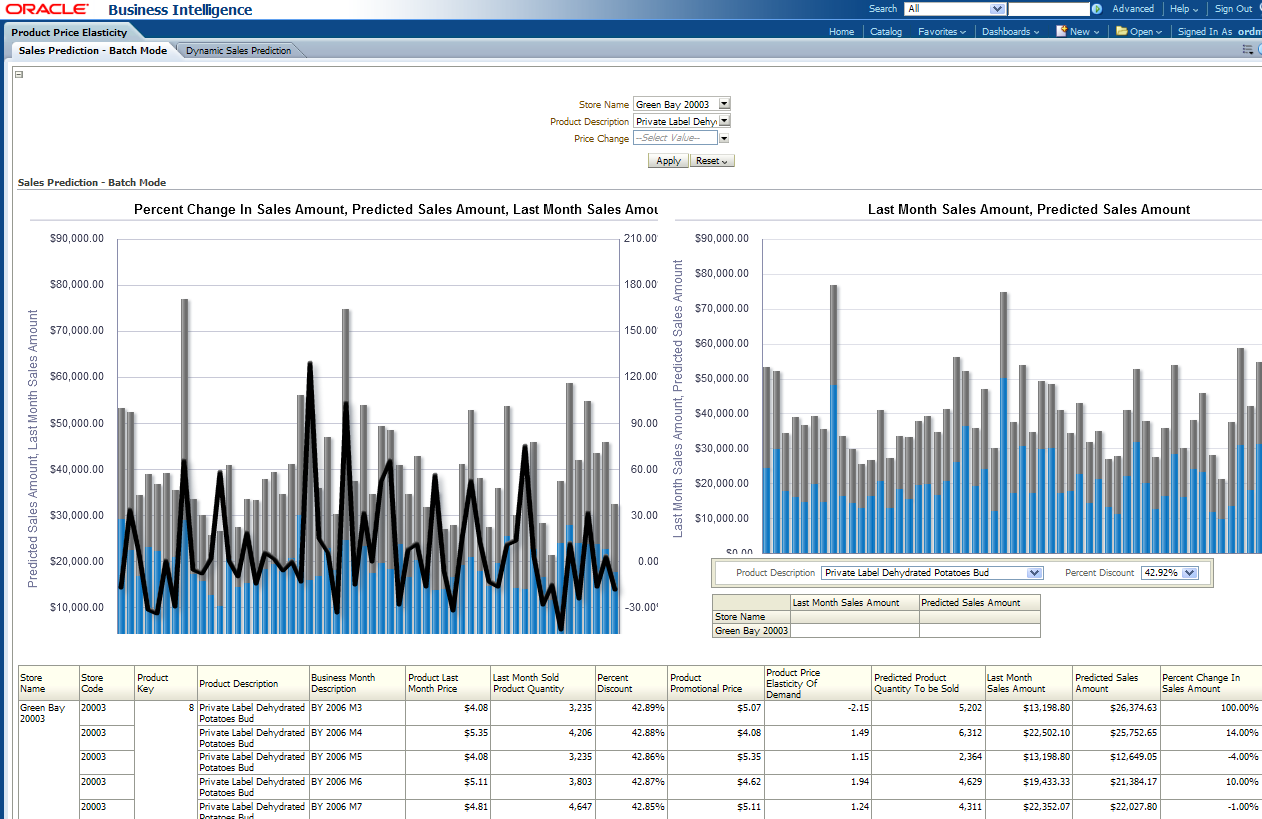
The product price elasticity area includes the following reports: Sales Prediction - Batch Mode and Dynamic Sales Prediction.
This report, as shown in Figure 12-51 provides sales prediction.
Report dimensions are:
Product
Organization
Business Time
Figure 12-51 Product Price Elasticity Sales Prediction Batch Mode Report
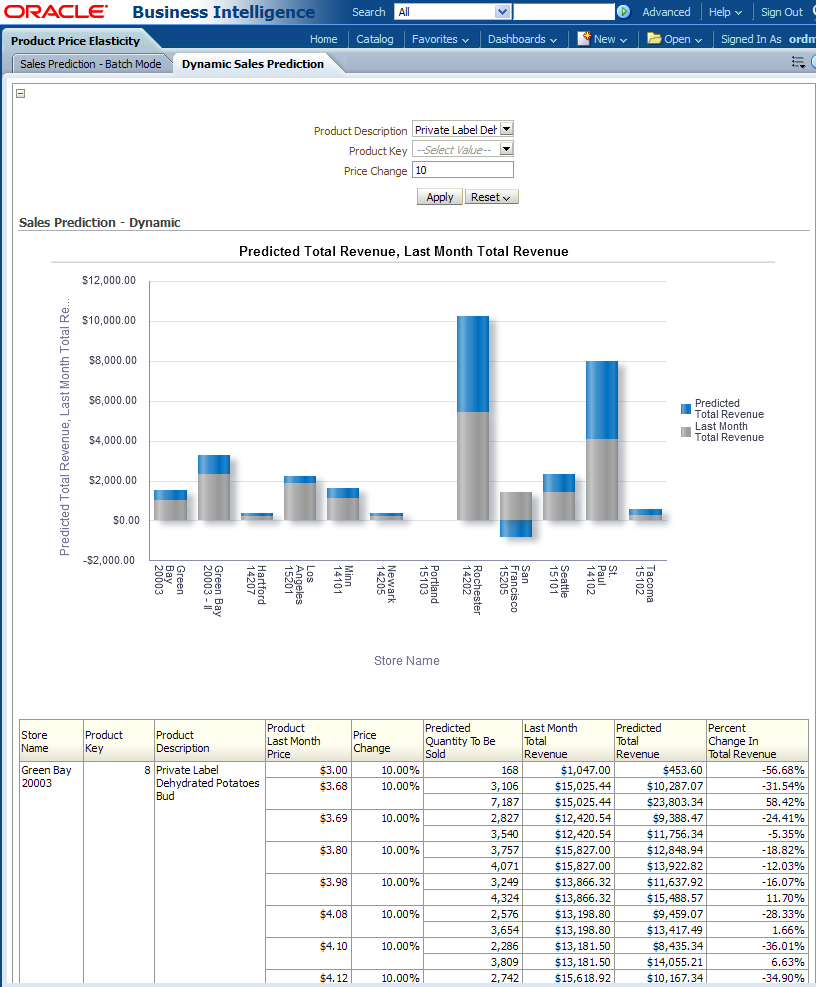
This report, as shown in Figure 12-52 provides dynamic sales prediction.
Report dimensions are:
Product
Organization
Business Time
Figure 12-52 Product Price Elasticity Dynamic Sales Prediction Report
The product category mix area includes the following reports: Product Category Mix, Product Set Rank by Support, and Product Set Rank by Probability.
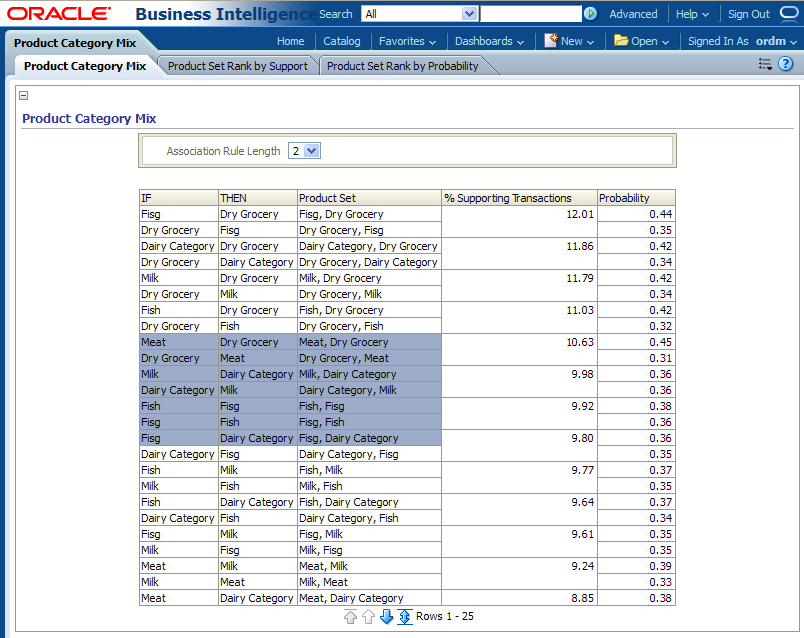
This report, as shown in Figure 12-53 provides information on product categories.
Report dimensions are:
Product
Organization
Business Time
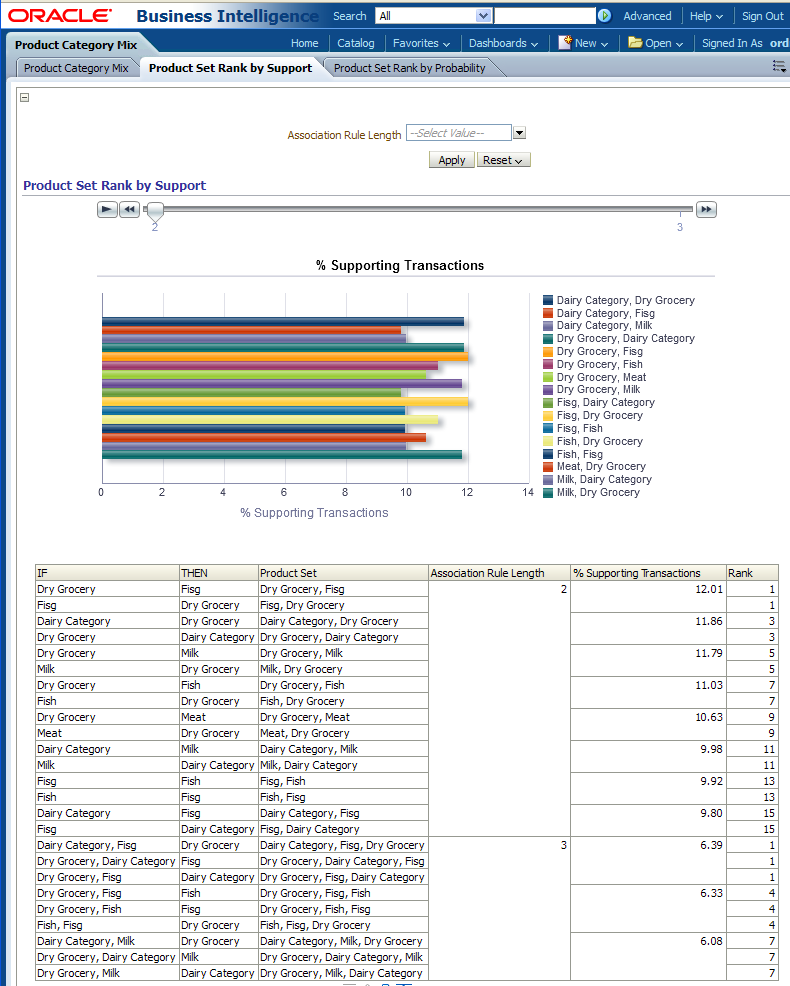
This report, as shown in Figure 12-54 provides sales prediction.
Report dimensions are:
Product
Organization
Business Time
Figure 12-54 Product Category Mix Product Set Rank by Support Report
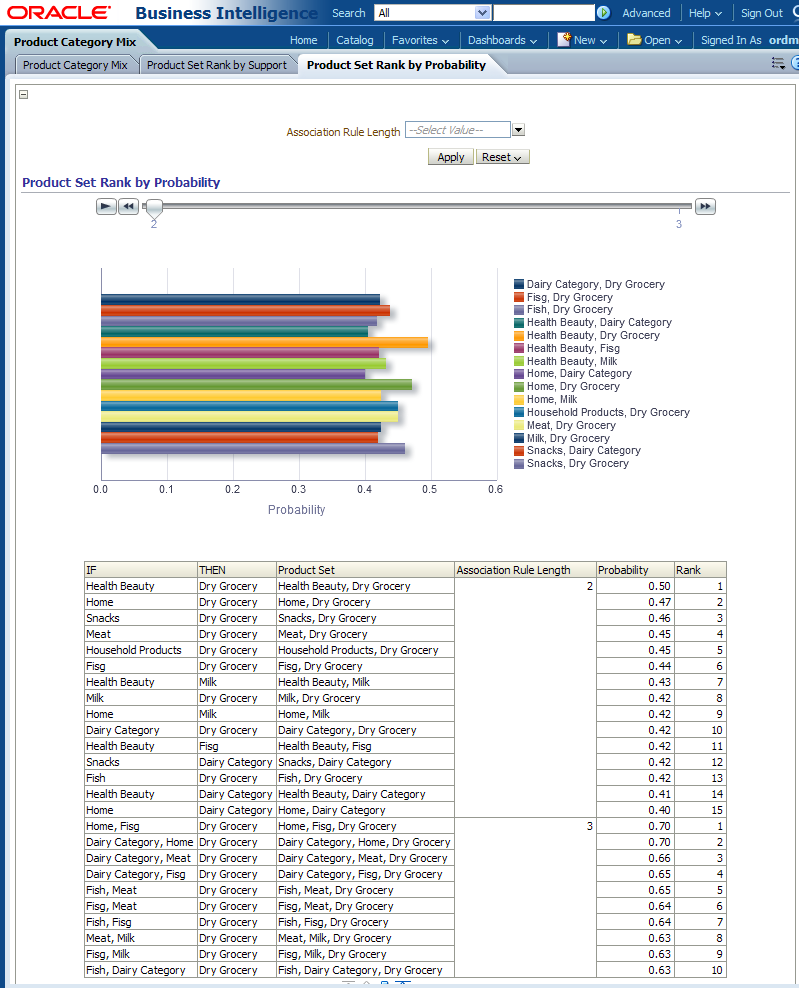
This report, as shown in Figure 12-55 provides sales prediction.
Report dimensions are:
Product
Organization
Business Time
Figure 12-55 Product Category Mix Product Set Rank by Probability Report
The merchandise reports include the following:
The flow analysis area includes the following reports: Fast Moving Items, Store Sales Flash Compared with Last Year, Department Chain Sales Flash, and Store Sales Flash.
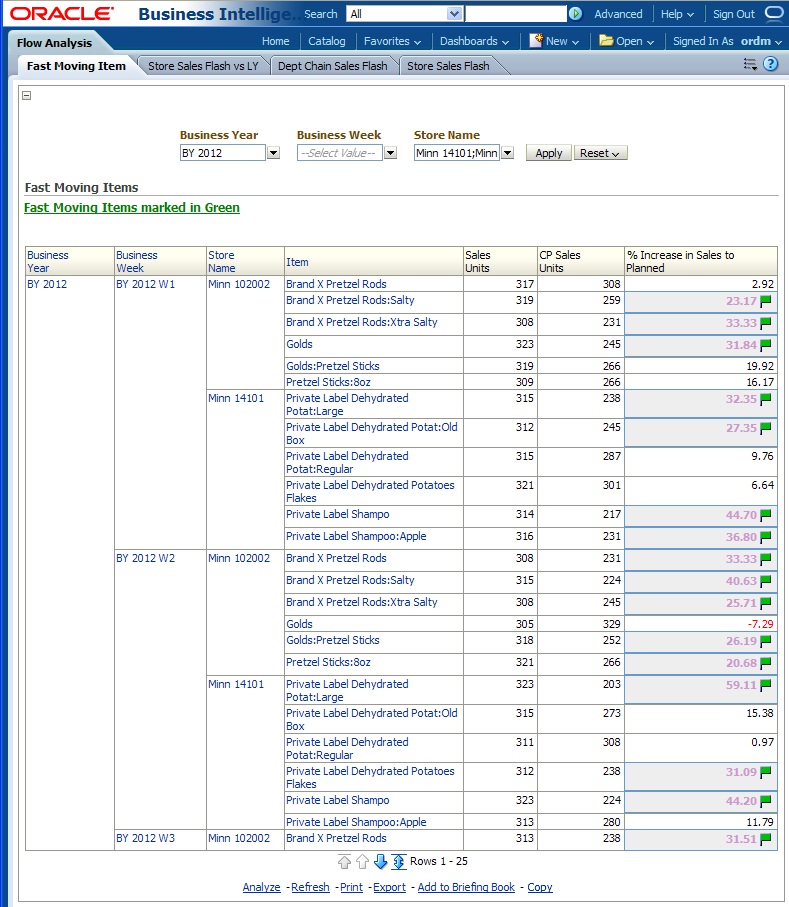
This report, as shown Figure 12-56 provides the year week-level "Fast Moving Items" information for each Store which can be compared with last year's metrics such as "Sales Units", "CP Sales Units", or "% Increase in Sales to Planned".
Report dimensions are:
Business Time
Product
Organization
Figure 12-56 Merchandise Flow Analysis Fast Moving Items Report
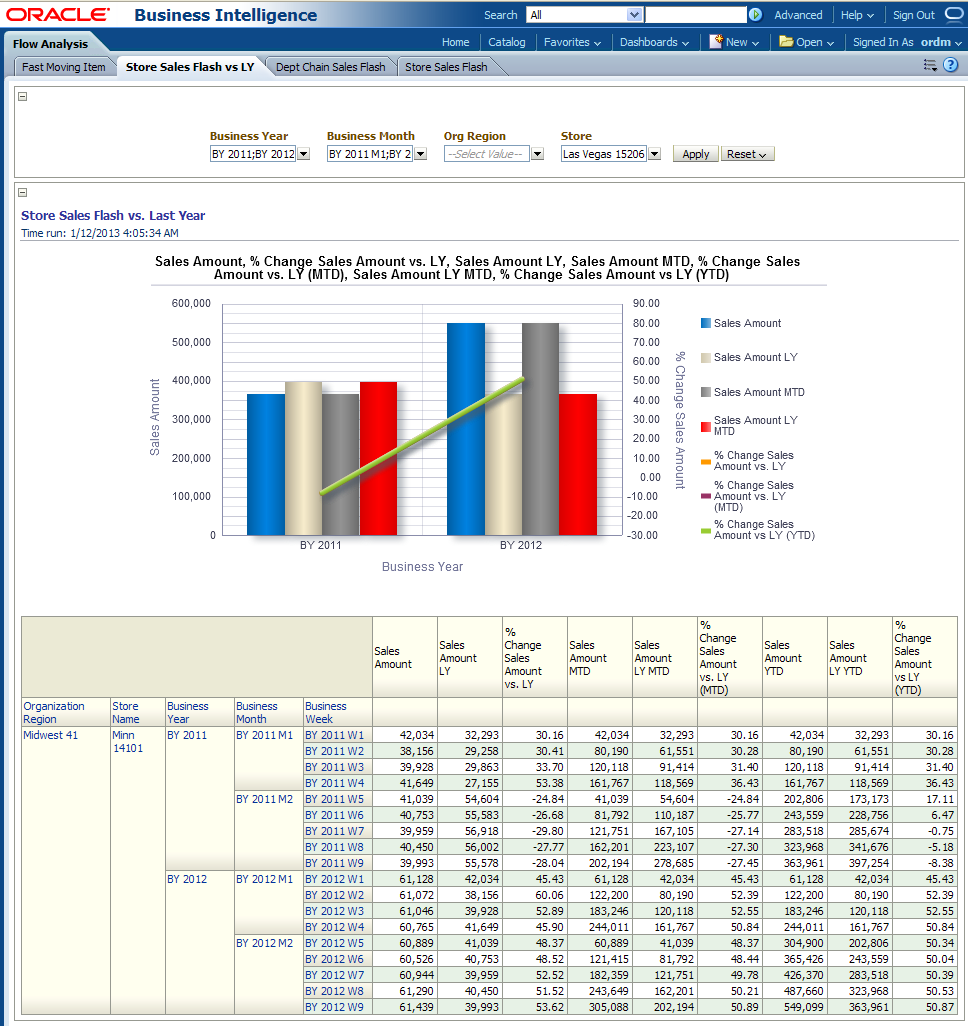
This report, as shown Figure 12-57 provides the store sales flash comparison.
Report dimensions are:
Business Time
Product
Organization
Figure 12-57 Store Sales Flash Compared with Last Year Report
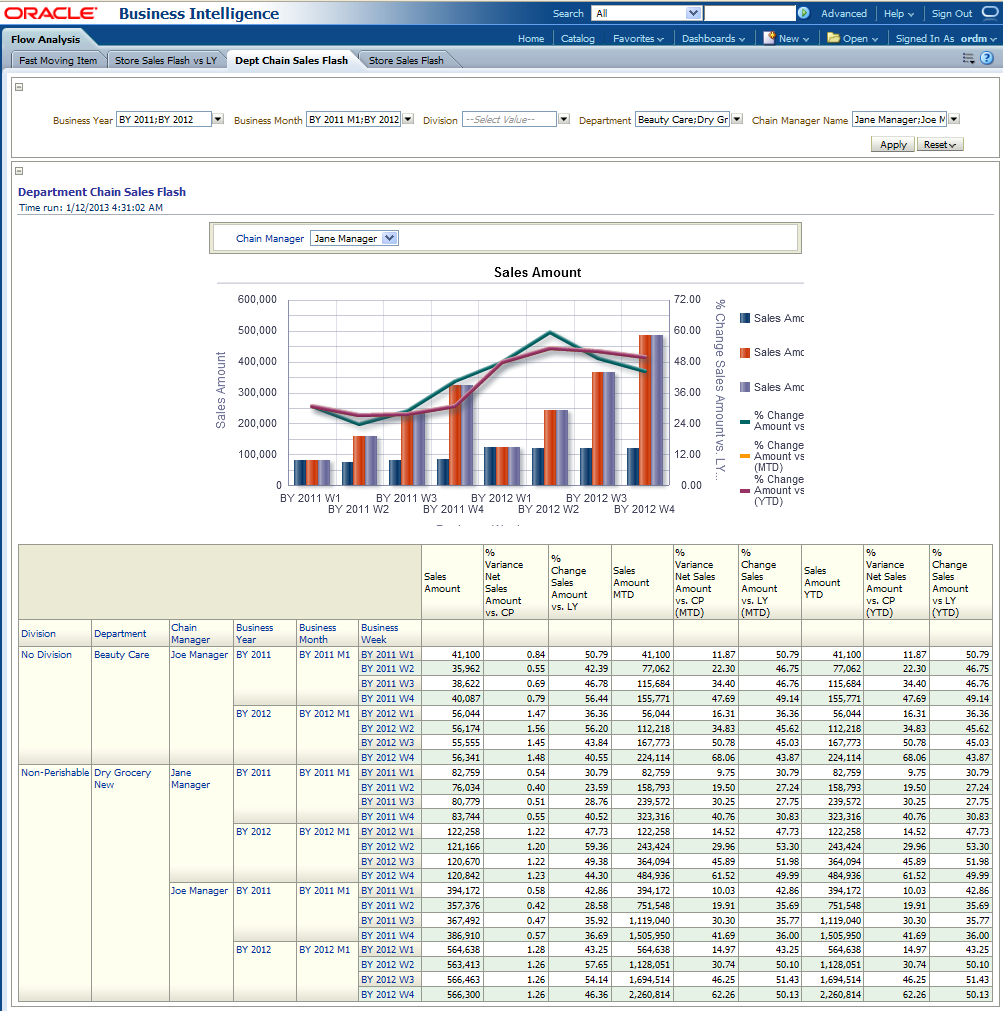
This report, as shown Figure 12-58 provides the department chain sales flash.
Report dimensions are:
Business Time
Product
Organization
Figure 12-58 Department Chain Sales Flash Report
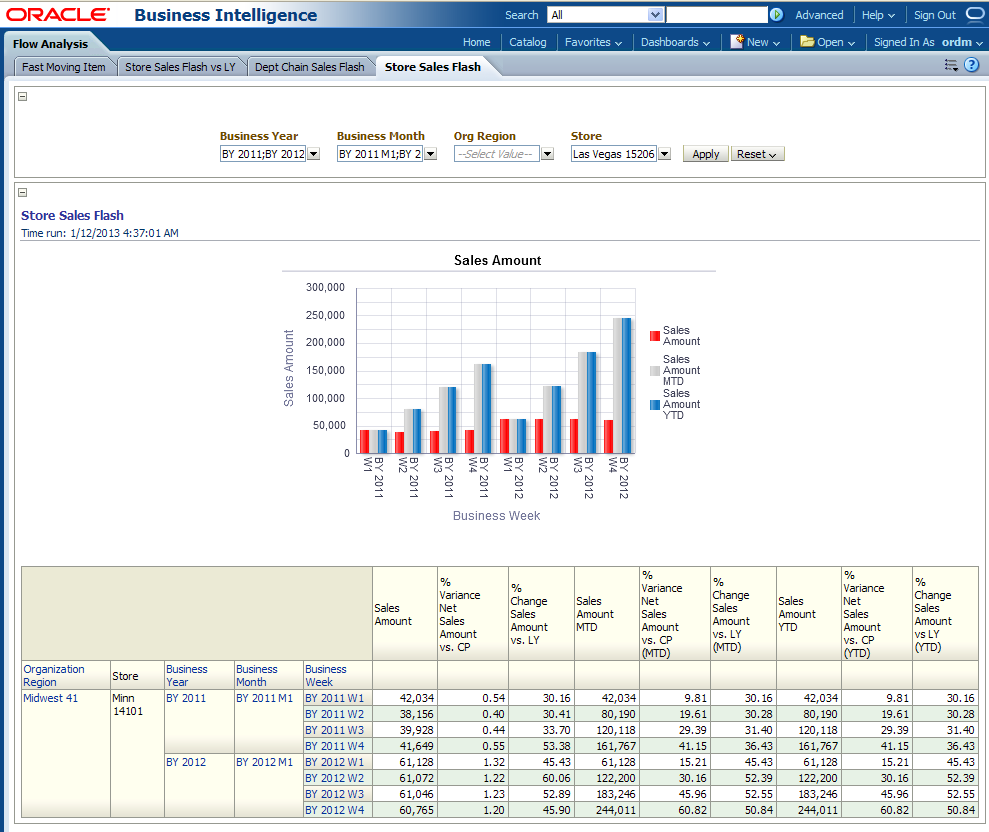
This report, as shown Figure 12-59 provides provides the store sales flash.
Report dimensions are:
Business Time
Product
Organization
The margin contribution area includes the following reports: Sales Analysis, Contribution to Chain, Organization Sales and Profit, Sales and Stock, Sales, Profit and Return Store, and Sales, Return and Profit Channel.
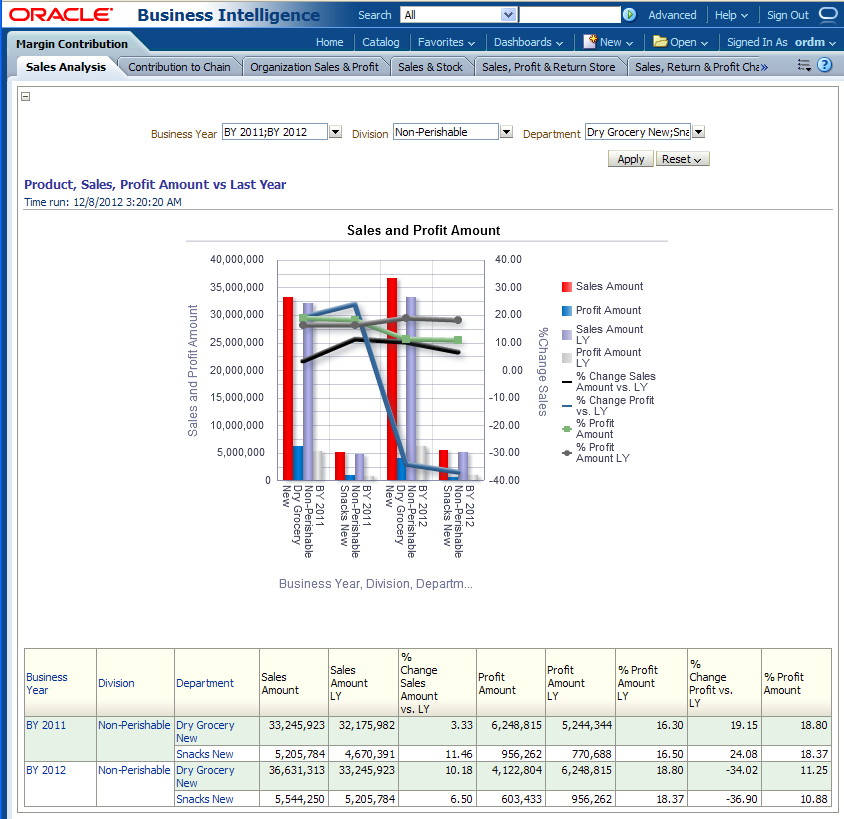
This report, as shown in Figure 12-60 provides sales and profit information compared to last year, by product.
Report dimensions are:
Business Time
Product
Figure 12-60 Margin Contributions Product, Sales, Profit Value Against Last Year Report
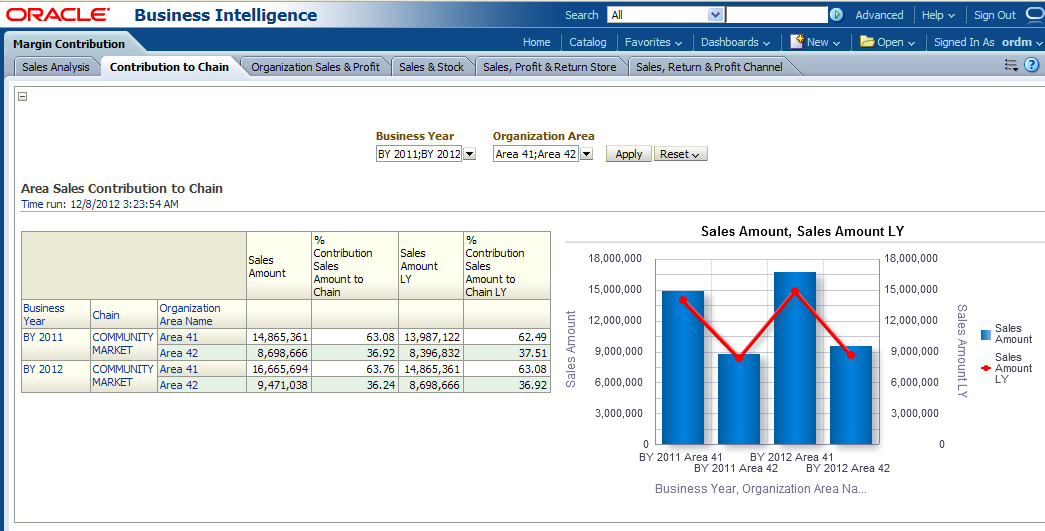
This report, as shown in Figure 12-61 provides area contribution to sales value for a chain.
Report dimensions are:
Business Time
Organization
Figure 12-61 Margin Contribution to Chain Report
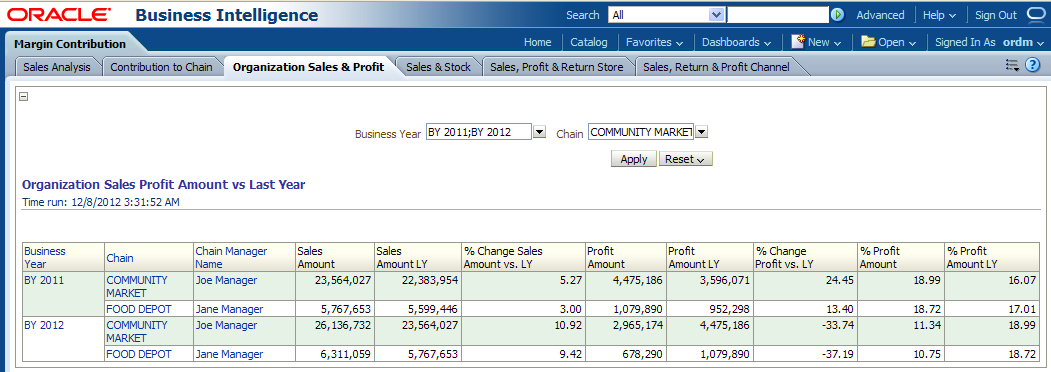
This report, as shown in Figure 12-62 provides sales, inventory and variance measures chain Manager and department.
Report dimensions are:
Business Time
Organization
Figure 12-62 Margin Contribution Organization Sales and Profit Report
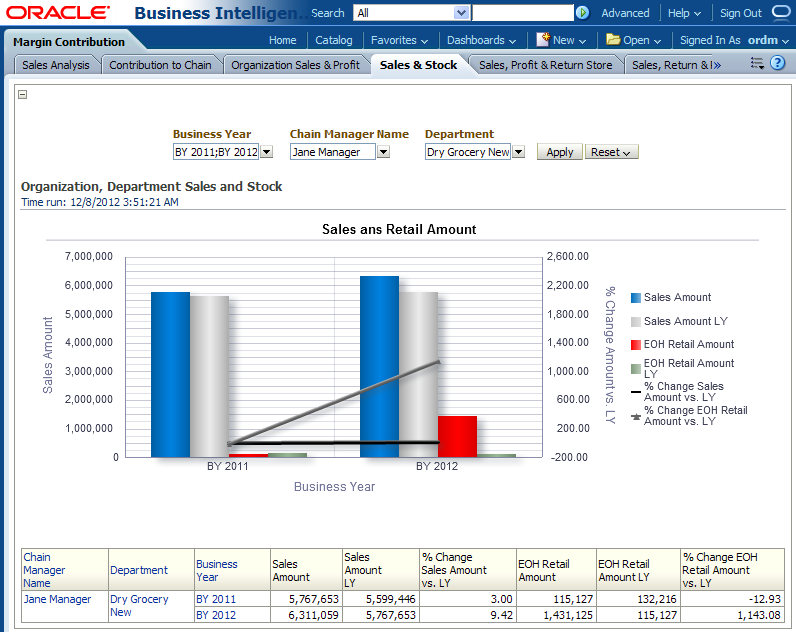
This report, as shown in Figure 12-63 provides sales, inventory and variance measures chain Manager and department.
Report dimensions are:
Business Time
Organization
Product
Figure 12-63 Margin Contribution Sales and Stock
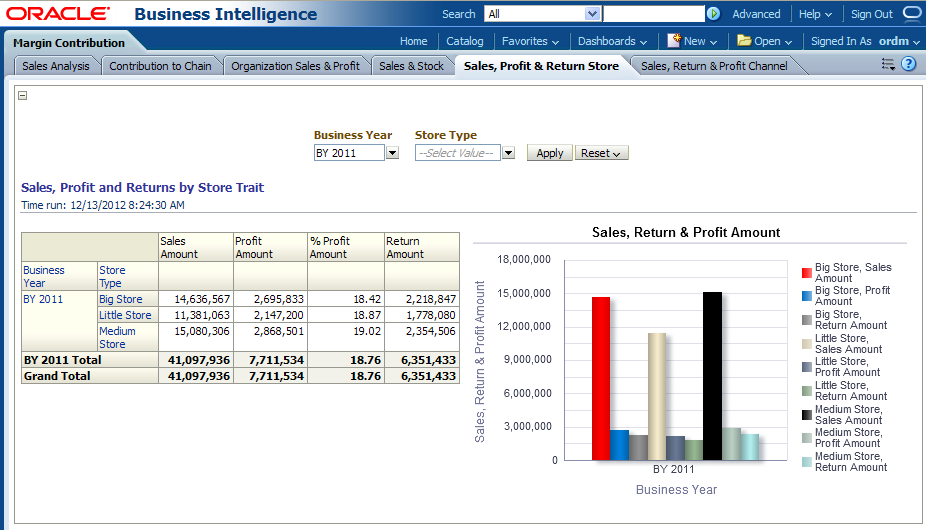
This report, as shown in Figure 12-64 provides sales, profit and return information based on store trait.
Report dimensions are:
Business Time
Organization
Figure 12-64 Margin Contribution Sales, Profit and Return by Store Trait Report
This report, as shown in Figure 12-65 provides sales, profit and return information by channel.
Report dimensions are:
Business Time
Organization
Figure 12-65 Margin Contribution Sales, Profit and Returns by Channel Report
The performance area includes the following reports: Contract Detail by Item, Vendor, Top Performance, Vendor Product Summary, Commitment Summary, Daily Performance, Monthly Performance, Pack Compared to Standalone Sales, Vendor Performance, Delivery and Timeliness, and Zero Selling.
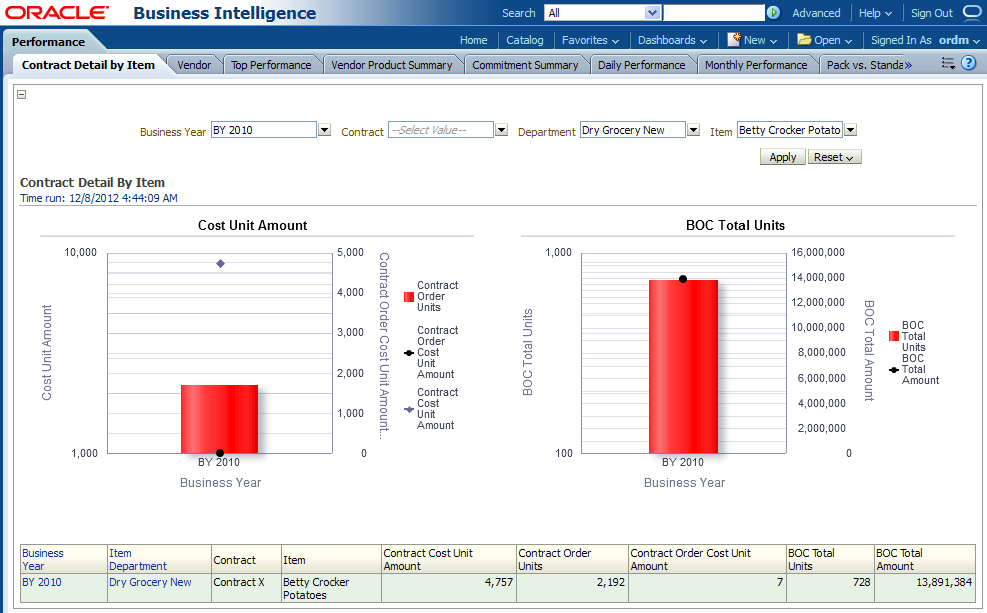
This report, as shown in Figure 12-66 contract detail by item. performance.
Report dimensions are:
Business Time
Product
Contract
Figure 12-66 Contract Detail by Item Report
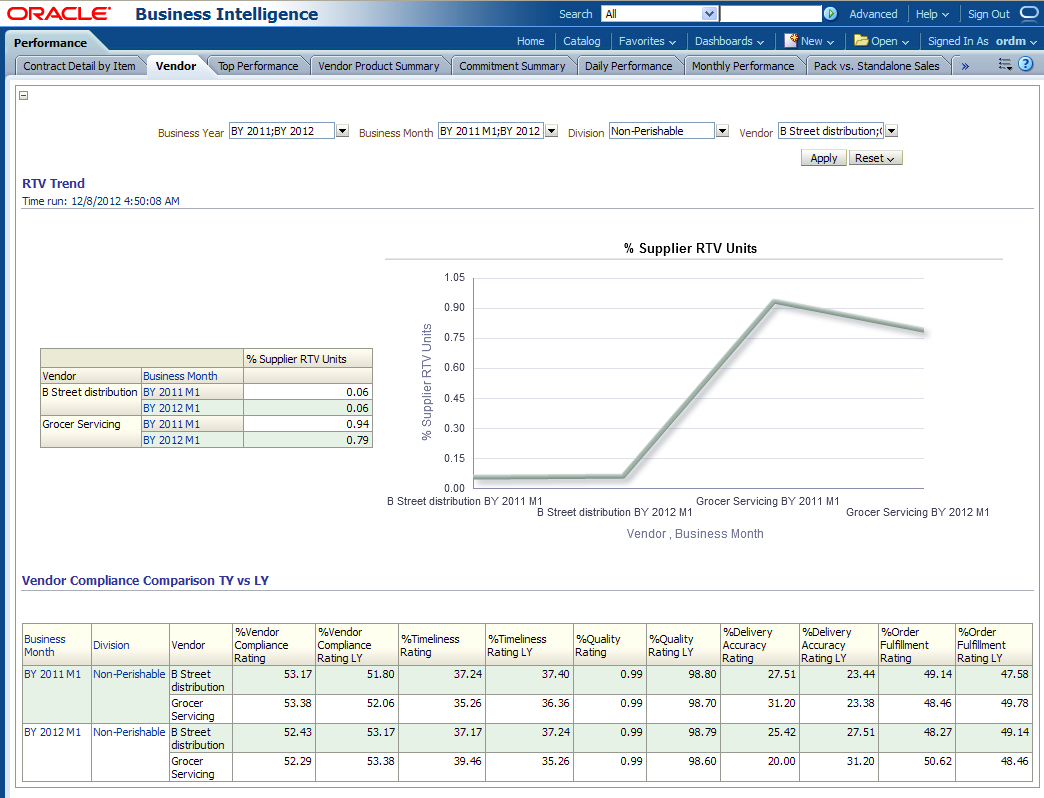
This report, as shown in Figure 12-67 provides comparison for all supplier compliance and rating measure for current year compared to last year.
Report dimensions are:
Business Time
Vendor
Product
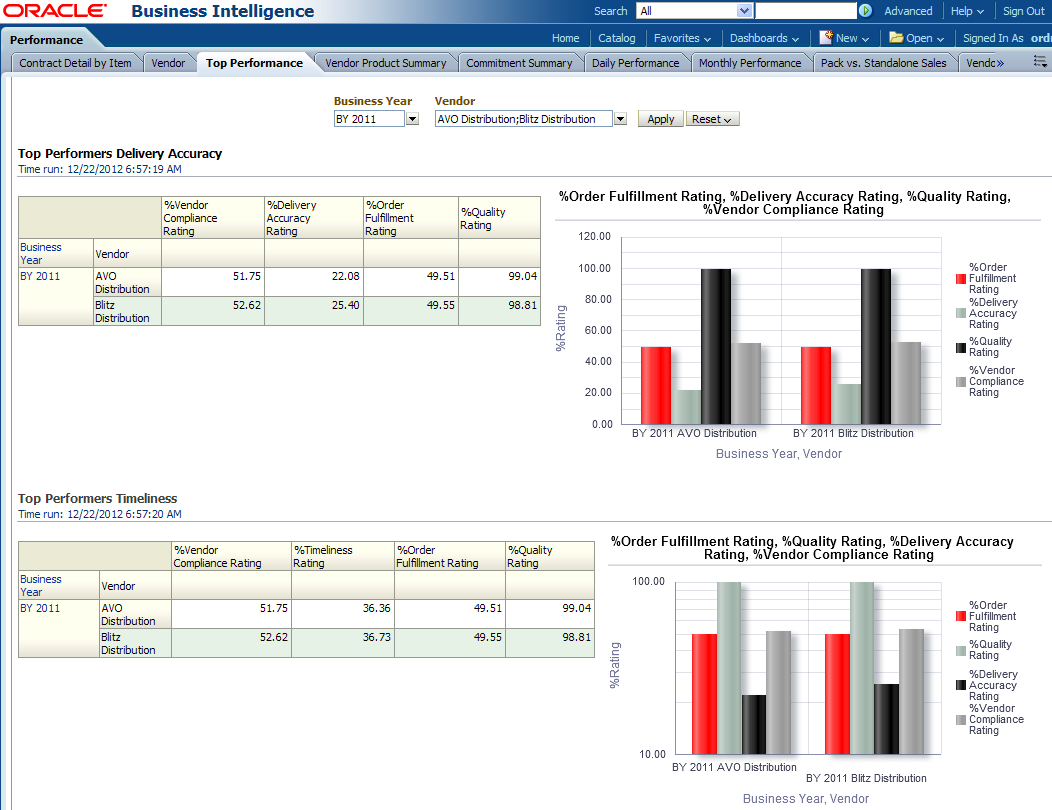
This report, as shown in Figure 12-68 provides the information about the top performance by vendors in delivery accuracy & timeliness.
Report dimensions are:
Business Time
Vendor
Figure 12-68 Margin Contribution Top Performance
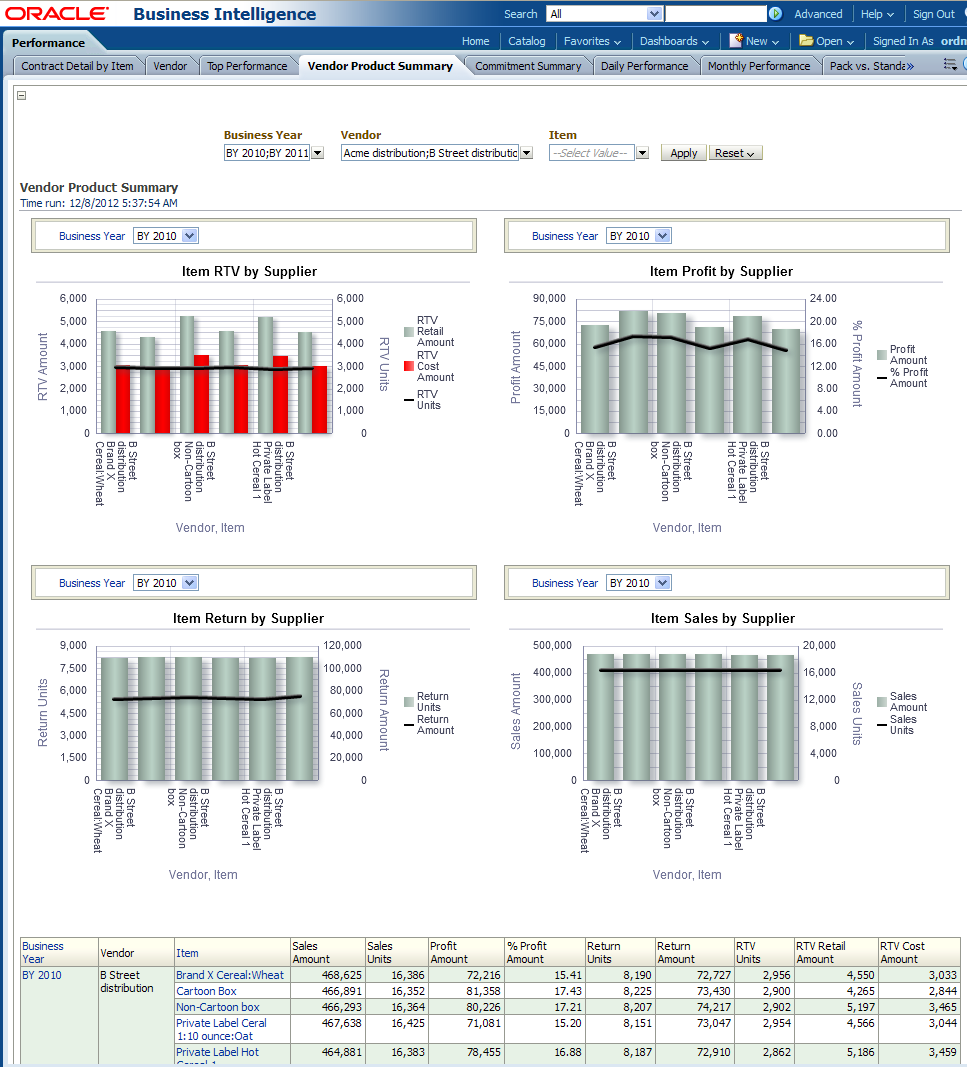
This report, as shown in Figure 12-69 provides unit sales, inventory and return measures by supplier, item and vendor product number.
Report dimensions are:
Business Time
Vendor
Product
Figure 12-69 Vendor Product Summary Report
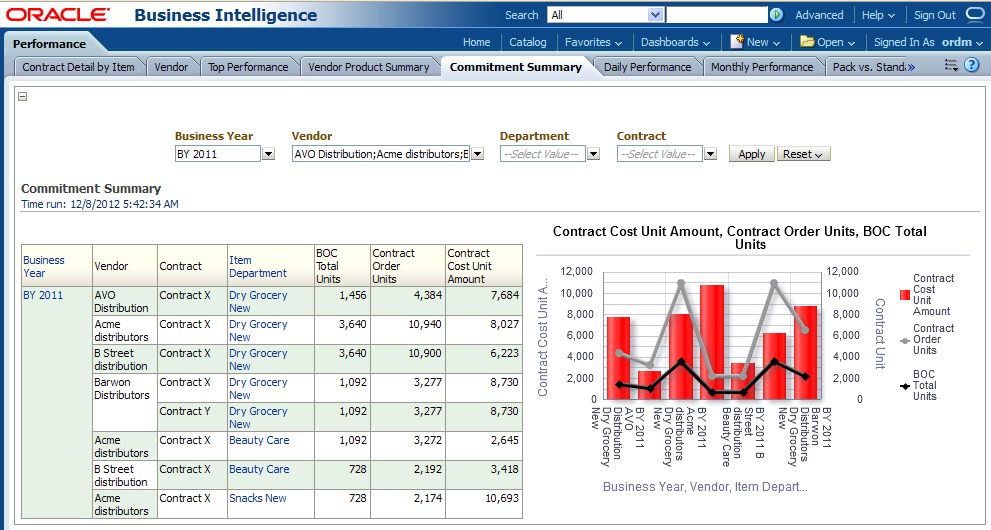
This report, as shown in Figure 12-70 provides commitment summary.
Report dimensions are:
Business Time
Vendor
Department
Figure 12-70 Performance Commitment Summary
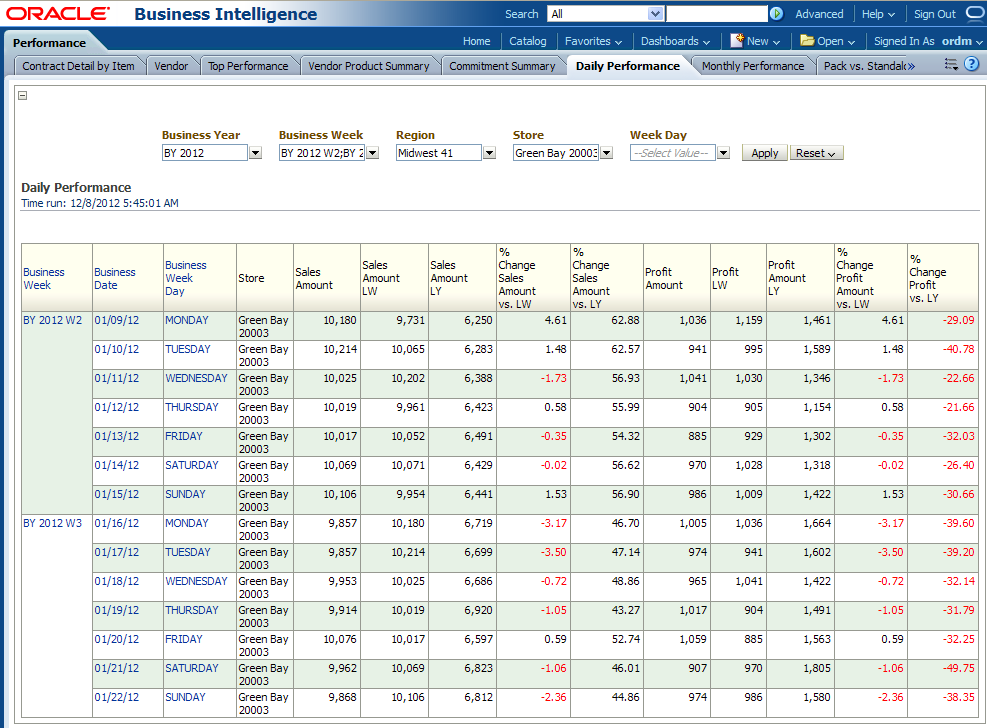
This report, as shown in Figure 12-71 provides daily store performance information based on transaction sales and profit measures for this day, last week, and last year.
Report dimensions are:
Business Time
Organization
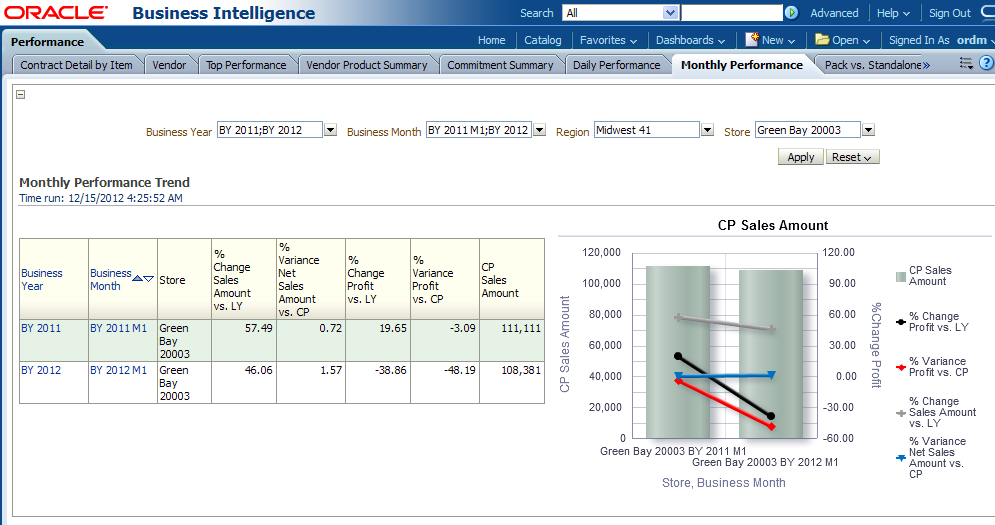
This report, as shown in Figure 12-72 provides monthly store performance information based on transaction sales and profit measures compared to last year and plan.
Report dimensions are:
Business Time
Organization
Figure 12-72 Monthly Performance Trend Report
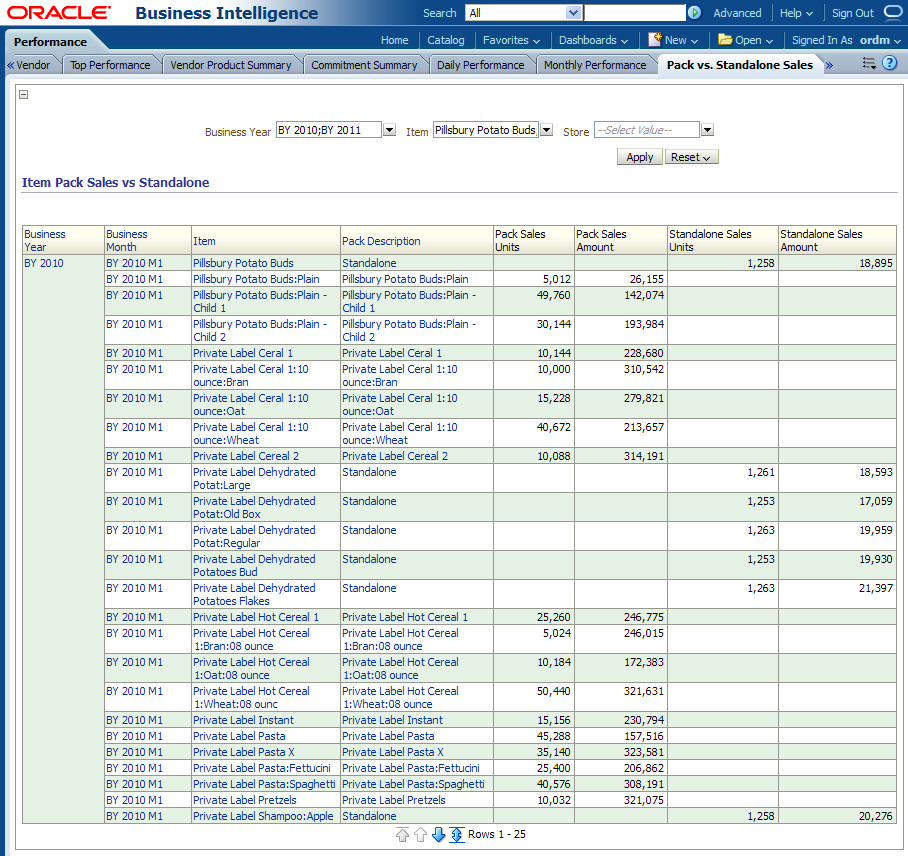
This report, as shown in Figure 12-73 compares and provides the yearly sales information of packed items with standalone items.
Report dimensions are:
Business Time
Product
Figure 12-73 Pack Compared to Standalone Sales
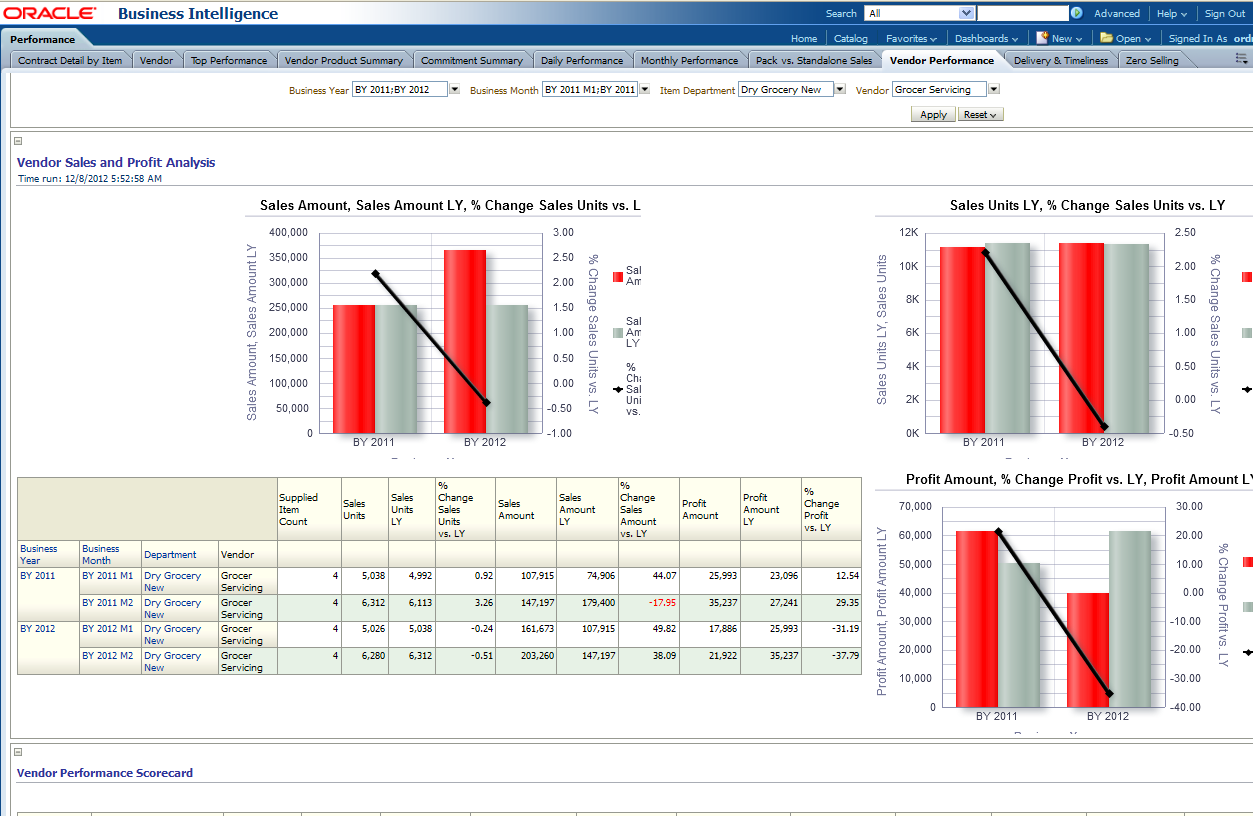
This report, as shown in Figure 12-74 compares and provides the yearly sales information of packed items with standalone items. This report provides the yearly, monthly "Vendor's performance" information for each vendor and item.
Report dimensions are:
Business Time
Product
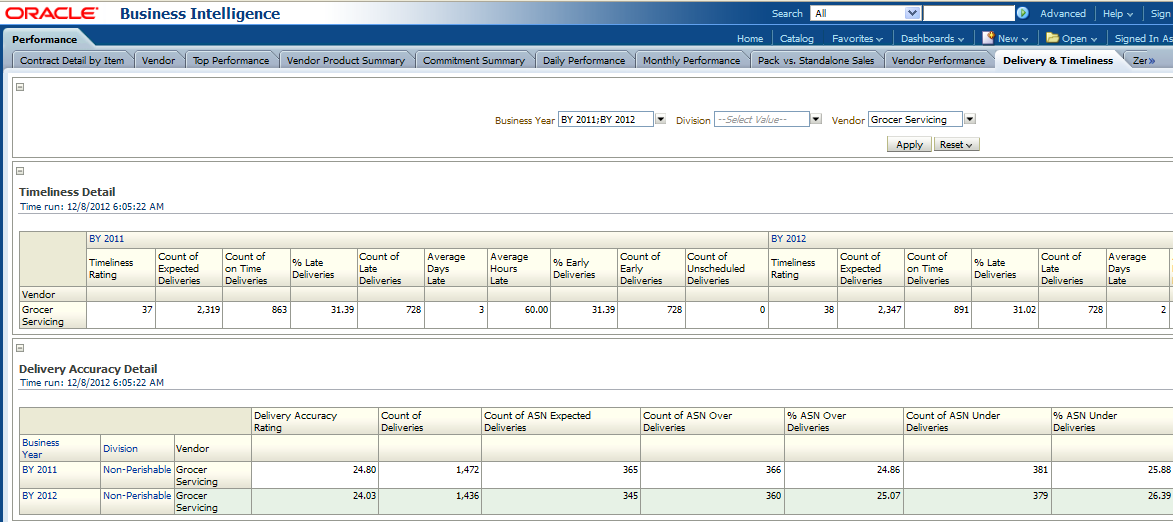
This report as shown in Figure 12-75, provides the timeliness details for each product division vendor.
Report dimensions are:
Business Time
Vendor
Figure 12-75 Delivery and Timeliness Report
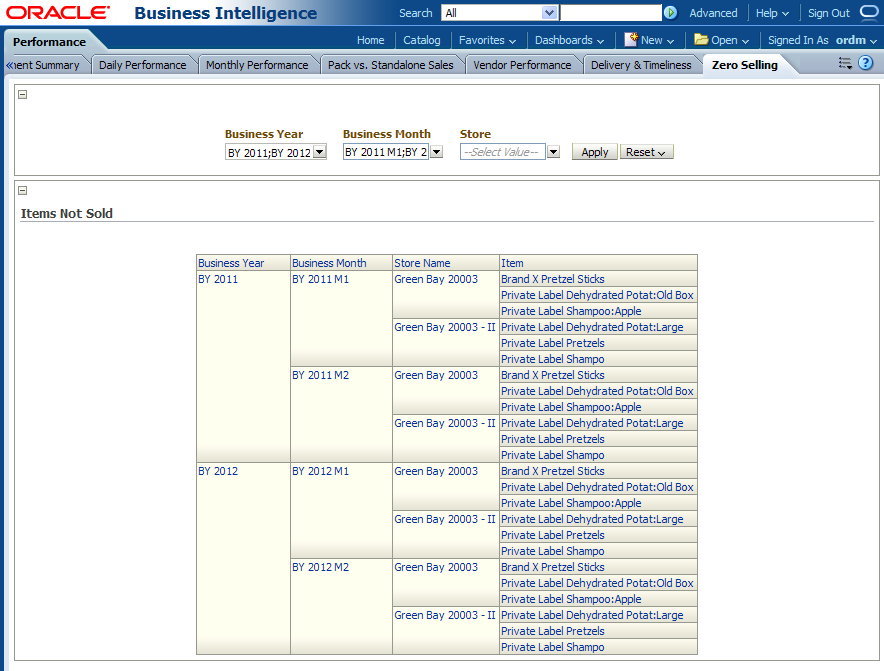
This report as shown in Figure 12-76 provides the timeliness details for each product division vendor.
Report dimensions are:
Business Time
Vendor
The sales analysis area includes the following reports: Product Sales & Return, Item Profit, Net Cost, Net Profit, Department Sales, Vendor Sales, Spatial Sales, and Markdown.
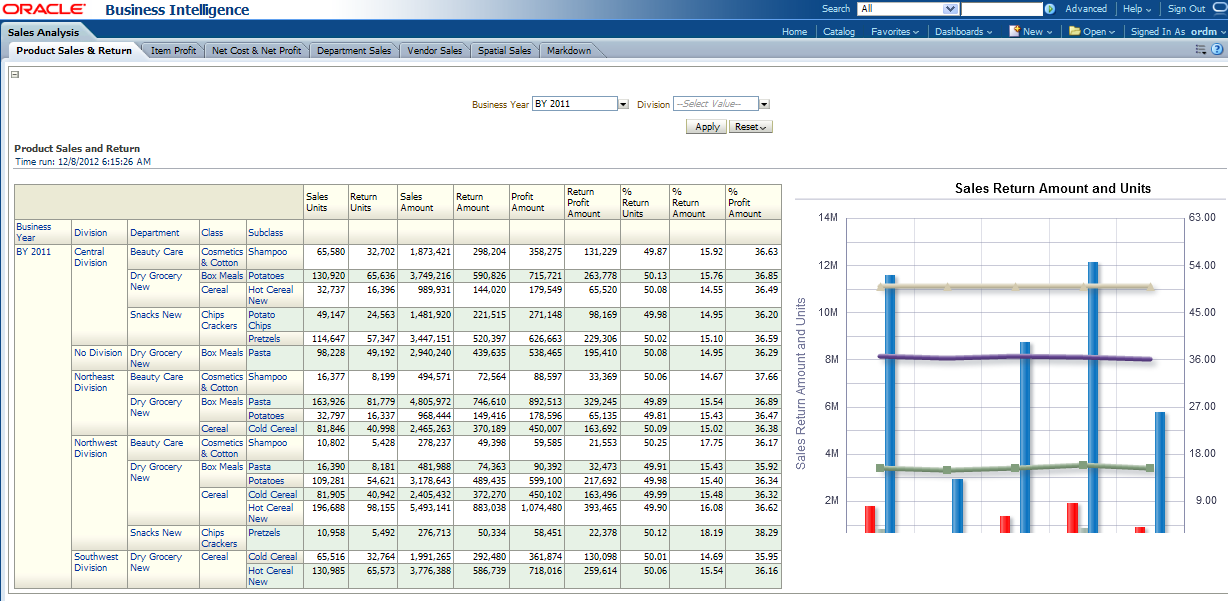
This report, as shown in Figure 12-77 provides sales, return and profit by product.
Report dimensions are:
Business Time
Product
Figure 12-77 Sales Analysis Product Sales and Return Report
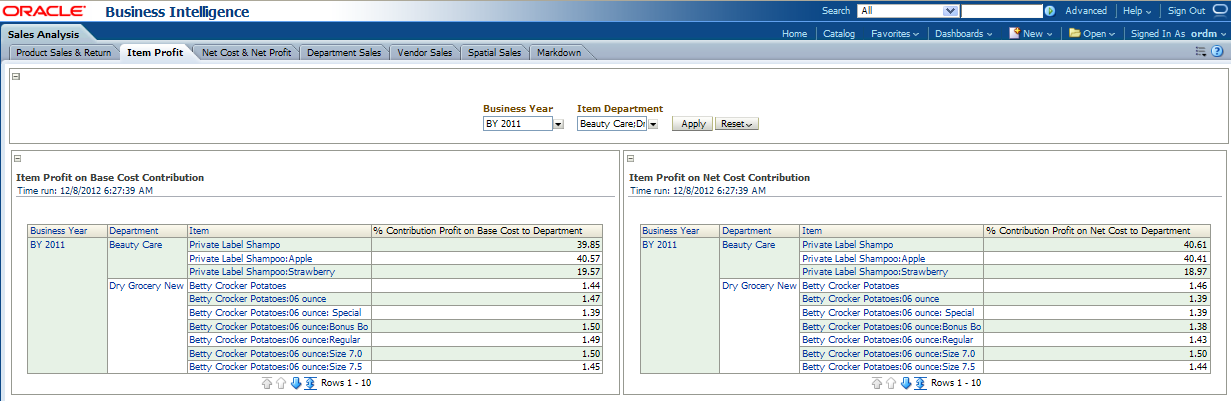
This report, as shown in Figure 12-78 provides the item profit of net cost contribution and base cost contribution.
Report dimensions are:
Business Time
Product
Figure 12-78 Sales Analysis Item, Profit Base Cost Contribution and net Cost Contribution Report
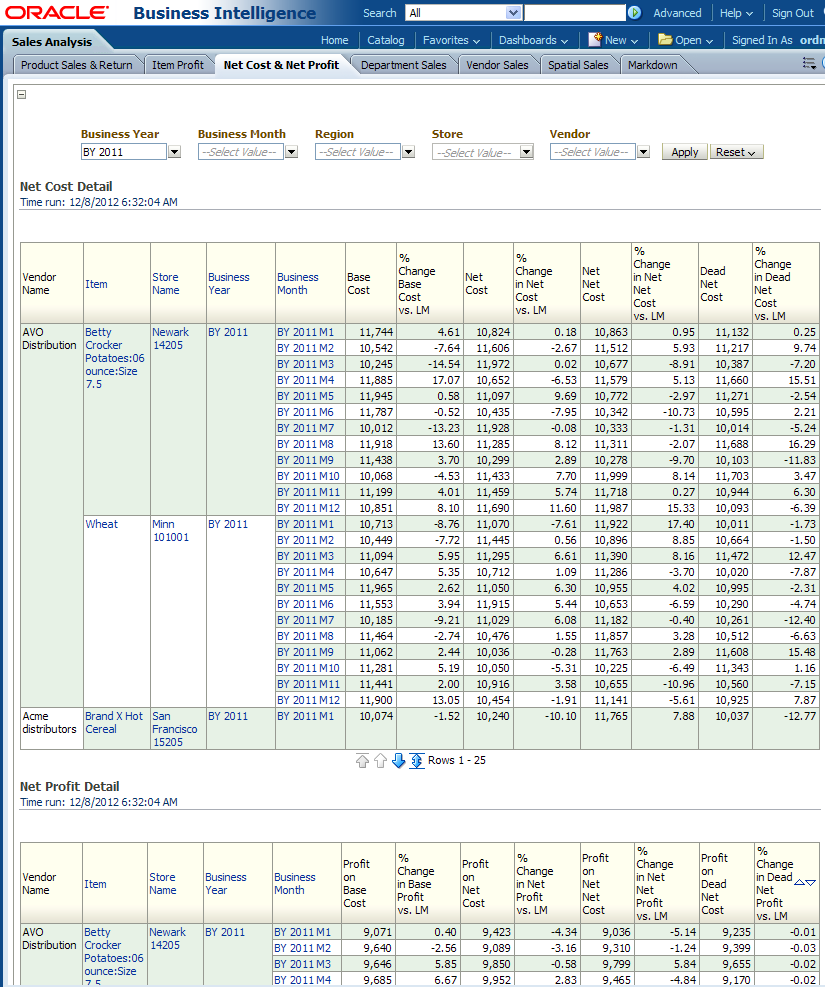
This report, as shown in Figure 12-79 provides yearly, monthly net sales and profit details for each vendor, item.
Report dimensions are:
Business Time
Organization
Product
Vendor
Figure 12-79 Sales Analysis Net Cost and Net Profit Report
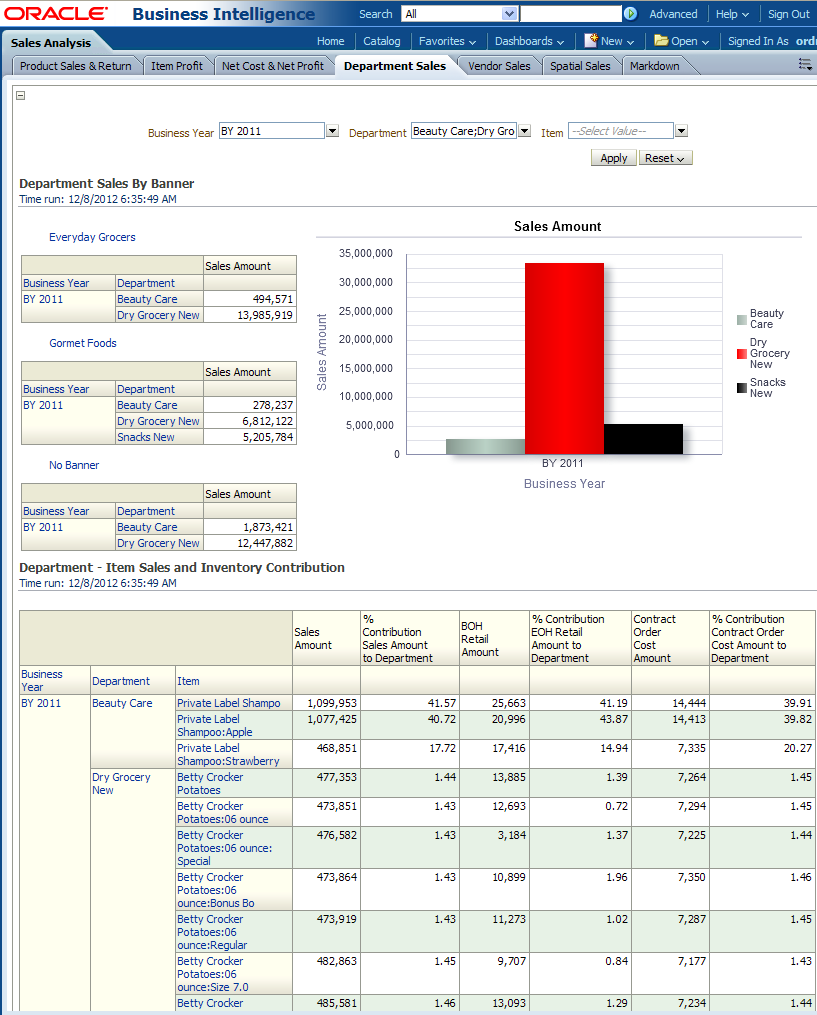
This report, as shown in Figure 12-80 provides sales value organized by department and banner. This report allows analysis of banner sales by department.
Report dimensions are:
Business Time
Product
Figure 12-80 Sales Analysis Department Sales Report
This report, as shown in Figure 12-81 provides the sales value by different channel like distribution and selling.
Report dimensions are:
Business Time
Product
Figure 12-81 Sales Analysis Vendor Sales Report
This report, as shown in Figure 12-82 provides the sales value by different channel like distribution and selling.
Report dimensions are:
Business Time
Product
Figure 12-82 Sales Analysis Spatial Sales Report
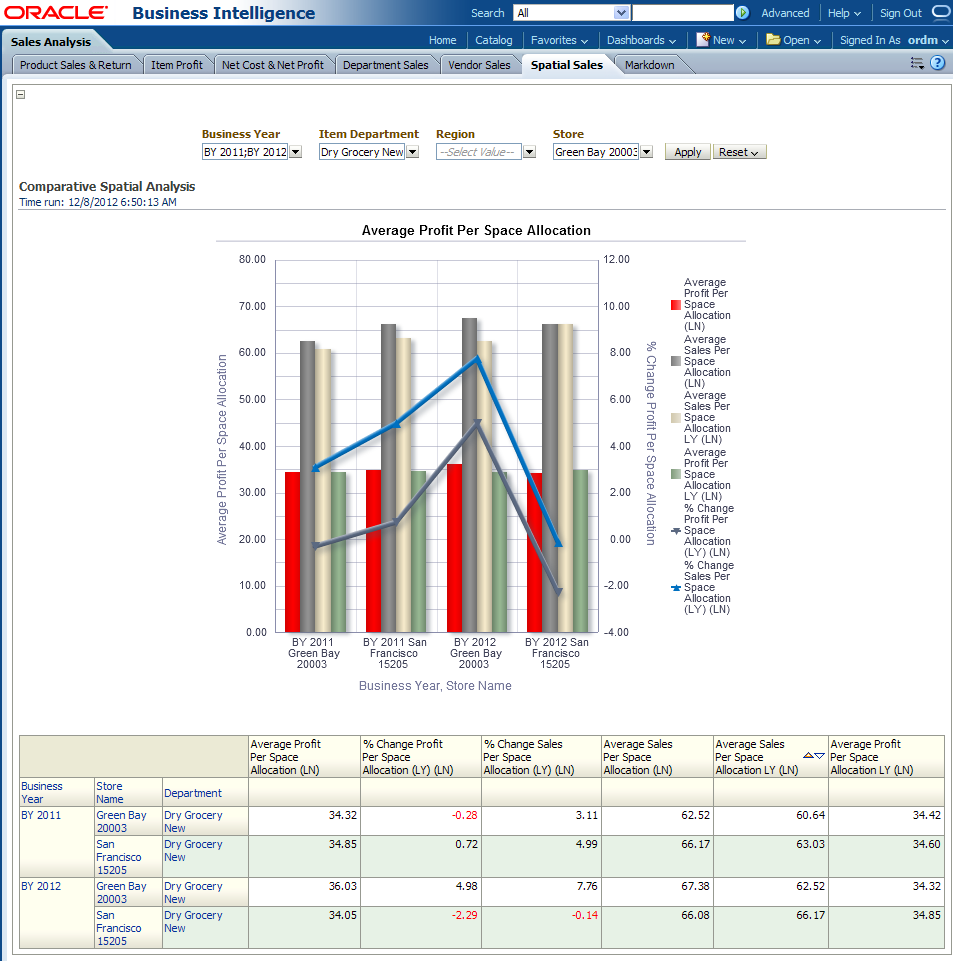
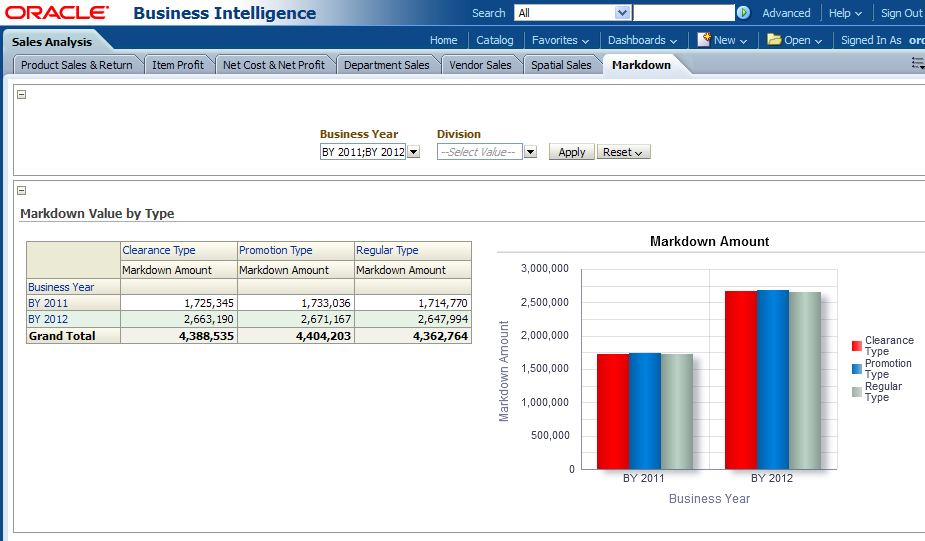
This report, as shown in Figure 12-83 provides the sales value by different channel like distribution and selling.
Report dimensions are:
Business Time
Product
Figure 12-83 Sales Analysis Markdown Report
The scorecard area includes the following reports: Sales Scorecard, Store Sales Scorecard, Vendor Scorecard, and Markdown Scorecard.
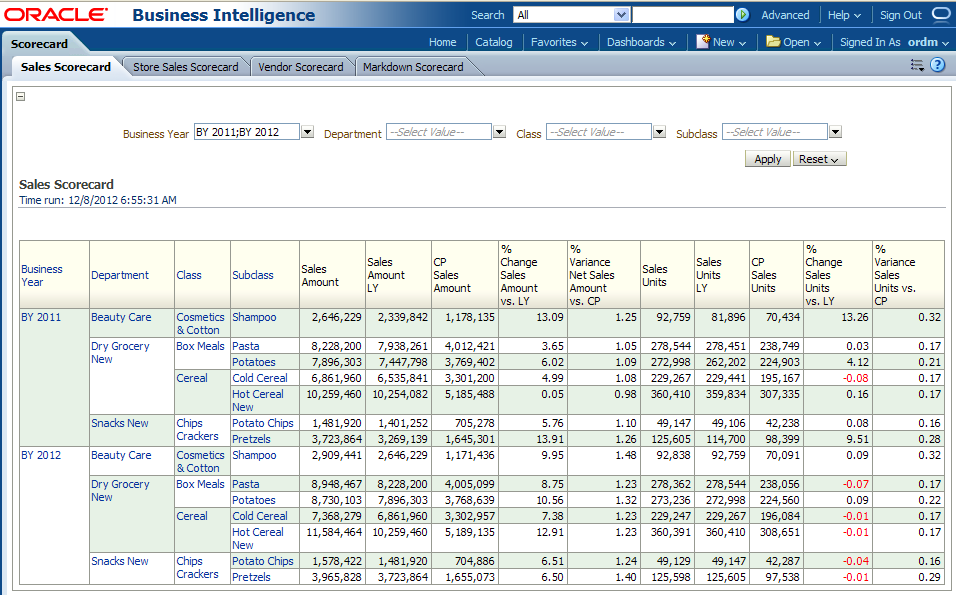
This report, as shown in Figure 12-84 provides (by store) department sales transaction sales units.
Report dimensions are:
Business Time
Product
Organization
Figure 12-84 Scorecard Sales Scorecard Report
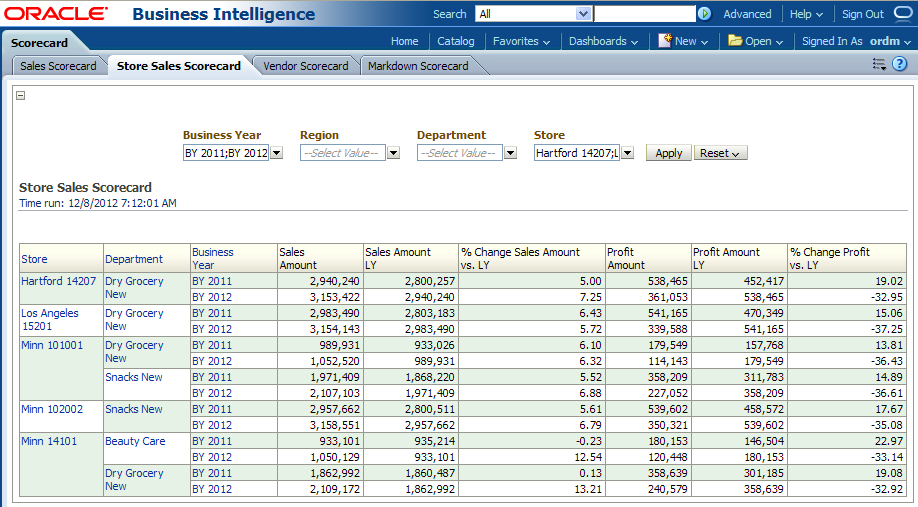
This report, as shown in Figure 12-85 provides (by store) department sales quantity, value and variance information compared to last year.
Report dimensions are:
Business Time
Product
Organization
Figure 12-85 Scorecard Store Sales Scorecard Report
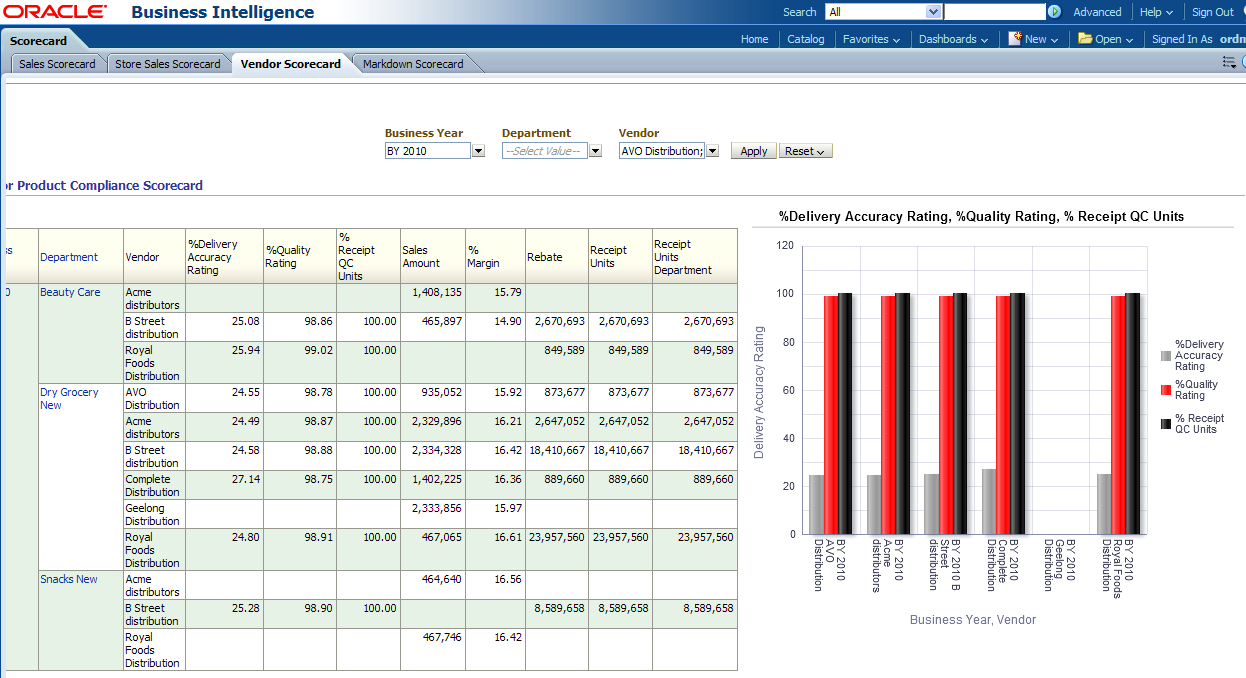
This report, as shown in Figure 12-86 provides (by vendor) department quality rating, sales value, margin and rebate.
Report dimensions are:
Business Time
Product
Vendor
Figure 12-86 Scorecard Vendor Scorecard Report
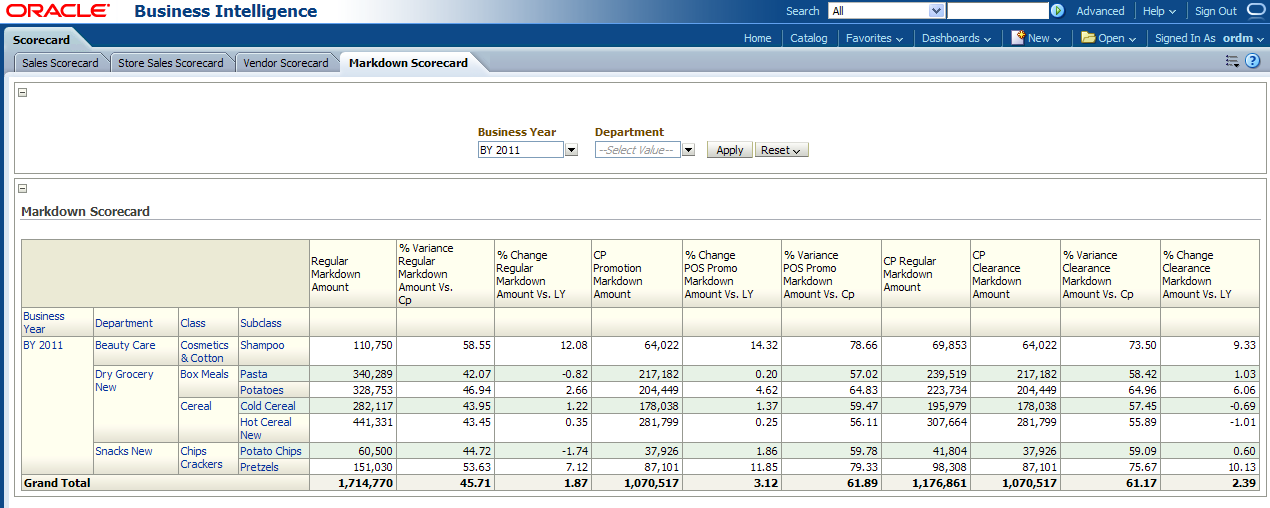
This report, as shown in Figure 12-87 provides (by vendor) department quality rating, sales value, margin and rebate.
Report dimensions are:
Business Time
Product
Vendor
Figure 12-87 Scorecard Markdown Scorecard Report
The stock movement area includes the following reports: Receipts, Stock Ledger, and Inventory Actual Comparison by Week.
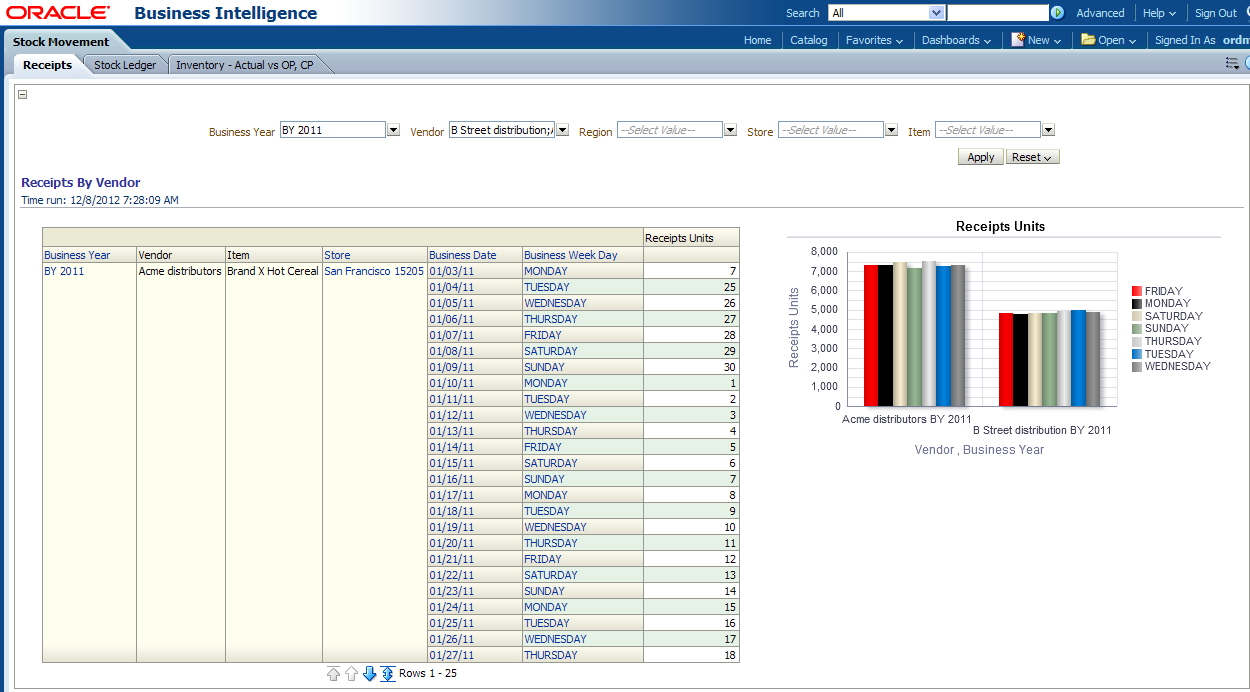
This report, as shown in Figure 12-88 provides "receipts by vendor" information such as items, stores, business date, business week day and receipt units listed by business year for a vendor.
Report dimensions are:
Business Time
Vendor
Organization
Figure 12-88 Stock Movement Receipts Report
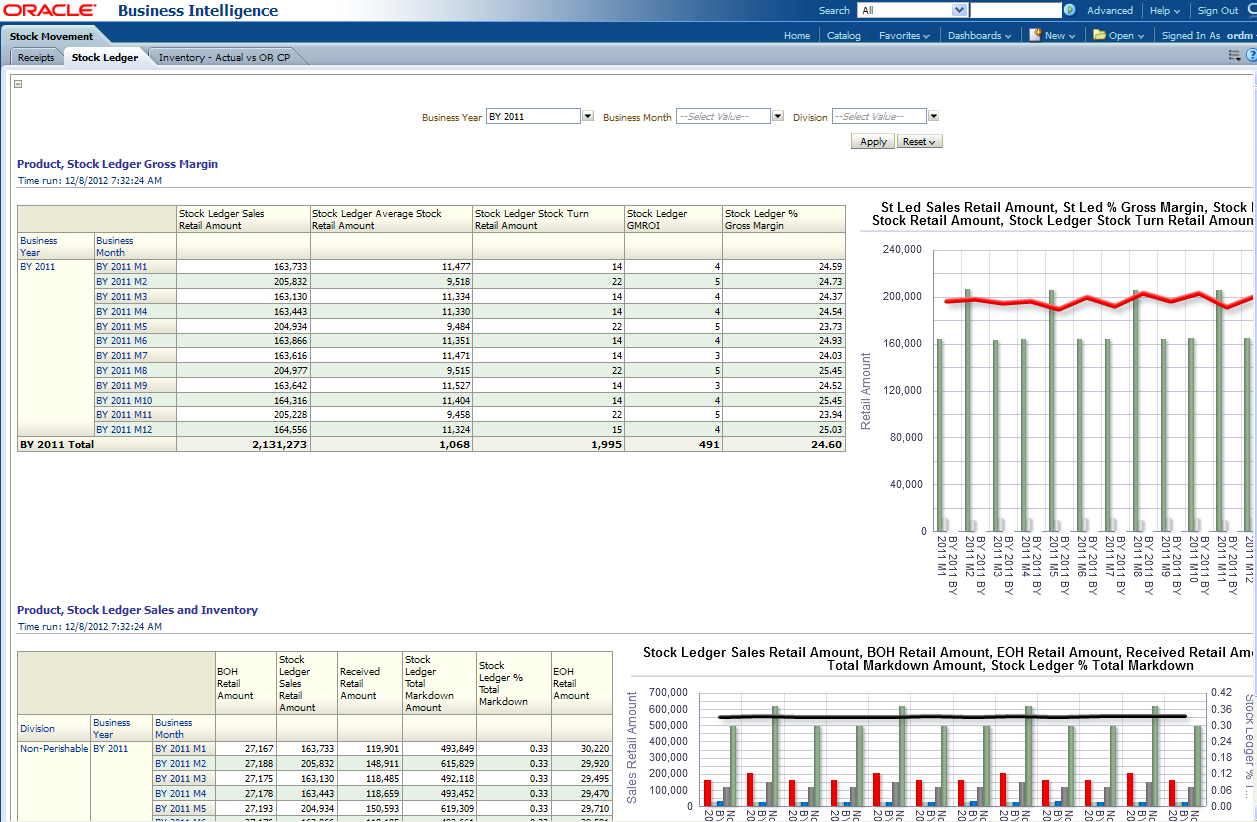
This report, as shown in Figure 12-89 provides "Product, Stock Ledger Gross Margin" and Product, Stock Ledger Sales and Inventory information.
Report dimensions are:
Business Time
Organization
Figure 12-89 Stock Movement Stock Ledger Report
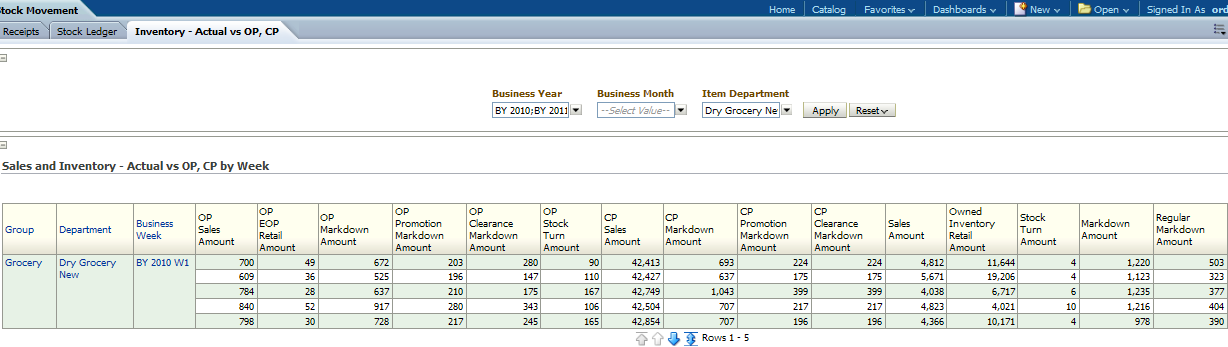
This report, as shown in Figure 12-90 provides the organization, inventory movement details.
Report dimensions are:
Business Time
Organization
Figure 12-90 Stock Movement Inventory Report
|
Copyright © 2009, 2013, Oracle and/or its affiliates. All rights reserved. Legal Notices |
|