| Oracle® Database 2 Day + Performance Tuning Guide 10g Release 2 (10.2) Part Number B28051-03 |
|
|
PDF · Mobi · ePub |
| Oracle® Database 2 Day + Performance Tuning Guide 10g Release 2 (10.2) Part Number B28051-03 |
|
|
PDF · Mobi · ePub |
This chapter describes how to identify and respond to real-time performance problems using the Database Performance page in Enterprise Manager. The Database Performance page in Oracle Enterprise Manager, shown in Figure 4-1, displays information in four sections that can be used to assess the overall performance of the database in real time.
Typically, you should use the automatic diagnostic feature of ADDM to identify performance problems with the database, as described in Chapter 3, "Automatic Database Performance Monitoring". In some cases, however, you may want to monitor the database performance in real time to identify performance problems as they happen. For example, ADDM performs its analysis after each AWR snapshot, which by default is once every hour. However, if you notice a sudden spike in database activity on the Database Performance page, you may want to investigate the incident before the next ADDM analysis. By drilling down to appropriate pages from the Database Performance page, you can identify performance problems with the database in real time. If a performance problem is identified, you can choose to run ADDM manually to analyze it immediately, without having to wait until the next ADDM analysis. For more information about running ADDM manually to analyze performance in real time, see "Manually Running ADDM to Analyze Current Database Performance".
This chapter contains the following sections:
The Average Active Sessions section on the Database Performance page, shown in Figure 4-2, shows how much CPU time each user is using, and whether or not there are users waiting for resources.
You can monitor database health and user activity using the Average Active Sessions graph. When the CPU Used value (shown in green) reaches the Maximum CPU line (shown as a dotted red line), the database instance is running at 100 percent of CPU time on the host system. All other values in the graph represent users waiting and contention for resources, which are categorized by wait classes in the legend. Values that use a larger block of active sessions represent bottlenecks caused a particular wait class, as indicated by the corresponding color in the legend. In the graph shown in Figure 4-2, the largest block of activity appears in green and corresponds to the CPU Used wait class as described in the legend. To identify each wait class, mouse over the block in the graph, and its corresponding wait class will be highlighted in the legend.
After a performance problem is discovered, it can be resolved in real time, directly from the Average Active Sessions section by:
Clicking a snapshot below the graph that corresponds to the time when the performance problem occurred to run ADDM for that time period.
For information about ADDM analysis, see "Reviewing the Automatic Database Diagnostics Monitor Analysis".
Creating a snapshot manually and clicking Run ADDM Now.
For information about creating snapshots manually, see "Creating Snapshots". For information about running ADDM manually, see "Manually Running ADDM to Analyze Current Database Performance".
Clicking Run ASH Report to create an ASH report to analyze transient performance problems that last for only a short period of time.
For information about ASH reports, see "Using Active Session History Reports"
Performing further investigation by drilling down to the wait class with the most active sessions, as described in the remainder of this section
In some cases, you may want to investigate the wait class that is using the greatest amount of wait time. To do so, identify and drill down to the wait class with the most active sessions by clicking the largest block of color on the graph or its corresponding wait class in the legend. This displays the Active Sessions Working page for that wait class, as shown in Figure 4-3.
The Active Sessions Working page shows a 1-hour time line. Details for each wait class are displayed in 5-minute intervals under Detail for Selected 5 Minute Interval. To move the 5-minute interval, drag and drop the shaded box to the time of interest. The information contained in the Detail for Selected 5 Minute Interval section is automatically updated to display the selected time period. Use this page to dynamically identify SQL statements or sessions that may be causing performance problems by analyzing the details of a wait class during the time period when the wait event occurred.
You can view the details of a wait class in different dimensions by:
The Top Working SQL section appears on the left side of the Active Sessions Working page under Detail for Selected 5 Minute Interval, as shown in Figure 4-4.
The Top Working SQL section displays the top SQL statements waiting for the corresponding wait class during the selected time period. If one or several SQL statements are using the majority of the wait time, as is the case shown in Figure 4-3, then they should be investigated.
To view details about a SQL statement, click the SQL ID link of the SQL statement. This displays the SQL Details page for the selected SQL statement. For information about viewing details on a SQL statement, see "Viewing Details of SQL Statements".
For SQL statements that are using the majority of the wait time, as is the case shown in Figure 4-3, use the SQL Tuning Advisor or create a SQL tuning set to tune the problematic SQL statements. For information about tuning SQL statements, see "Tuning SQL Statements Using the SQL Tuning Advisor".
By default, the Top Working Sessions section appears on the right side of the Active Sessions Working page under Detail for Selected 5 Minute Interval, as shown in Figure 4-5.
The Top Working Sessions section displays the top sessions waiting for the corresponding wait class during the selected time period. Sessions represent specific user connections to the database through a user process. A session lasts from the time the user connects until the time the user disconnects or exits the database application. For example, when a user starts SQL*Plus, the user must provide a valid user name and password, and then a session is established for that user. If a single session is using the majority of the wait time, as is the case shown in Figure 4-5, then it should be investigated.
To view details about a session, click the Session ID link of the session. This displays the Session Details page, as shown in Figure 4-6, which contains information such as session activity, session statistics, open cursors, blocking sessions, and wait events for the selected session.
After the information is analyzed, you can choose to end the session by clicking Kill Session. In this example, because the session is consuming 100 percent of database activity, you should consider ending the session and proceeding to tune the SQL statement that this session is running.
See Also:
Chapter 10, "Tuning SQL Statements" for information about tuning SQL statements
The Top Services section can be accessed by selecting Top Services from the View list on the right side of the Active Sessions Working page under Detail for Selected 5 Minute Interval. The Top Services section displays the top services waiting for the corresponding wait event during the selected time period, as shown in Figure 4-7.
Services represent groups of applications with common attributes, service-level thresholds, and priorities. For example, the SYS$USERS service is the default service name used when a user session is established without explicitly identifying its service name, and the SYS$BACKGROUND service consists of all Oracle Database background processes. If a single service is using the majority of the wait time, as is the case shown in Figure 4-7, then it should be investigated. To view details about a service, click the Service link of the service. This displays the Service page, as shown in Figure 4-8, which lists the top modules and statistics for the selected service.
In this example, the SQL*Plus module is consuming 98 percent of the database activity for this service. The SQL statements that this service is running should be investigated.
The Top Modules section can be accessed by selecting Top Modules from the View list on the right side of the Active Sessions Working page under Detail for Selected 5 Minute Interval. The Top Modules section displays the top modules waiting for the corresponding wait event during the selected time period, as shown in Figure 4-9.
Modules represent the applications that set the service name as part of the workload definition. For example, the DBMS_SCHEDULER module may assigns jobs that run within the SYS$BACKGROUND service. If a single module is using the majority of the wait time, as is the case shown in Figure 4-9, then it should be investigated. To view details about a module, click the Module link of the module. This displays the Module page, which lists the top actions and contains statistics for the selected module.
The Top Actions section can be accessed by selecting Top Actions from the View list on the right side of the Active Sessions Working page under Detail for Selected 5 Minute Interval. The Top Actions section displays the top actions waiting for the corresponding wait event during the selected time period, as shown in Figure 4-10.
Actions represent the jobs that are performed by a module. For example, the DBMS_SCHEDULER module can run the GATHER_STATS_JOB action to gather statistics on all database objects. If a single action is using the majority of the wait time, then it should be investigated. To view details about an action, click the Action link of the action. This displays the Action page, which contains statistics for the selected action.
The Instance Disk I/O and Instance Throughput sections on the Database Performance page shown in Figure 4-11 displays:
Number of physical reads, physical writes, logons, and transactions per second
Number of physical reads, physical writes, and logons per transaction
To view the top sessions for each type of activity, click the corresponding link in the legend. This displays the Top Sessions page for that activity. On the Top Sessions page, you can view information about each session by selecting a session and clicking View. After the information is analyzed, you can choose to end the session by clicking Kill Session.
The Host section on the Database Performance page, shown in Figure 4-12, displays utilization information about the system hosting the database.
Before analyzing the database, you should first verify if the host system has enough CPU, memory, and disk resources available to run the database. To view details about CPU, memory, and disk utilization, click the CPU Utilization % link in the legend. The Performance Summary page appears, as shown in Figure 4-13.
The Performance Summary page displays metric values for CPU utilization, memory utilization, disk I/O utilization, and the top 10 processes ordered by both CPU and memory utilization.
To determine if the host system has enough resources available to run the database, first establish appropriate expectations for the amount of resources your system should be using. Then, determine whether sufficient resources are available and recognize when your system is using too many resources. Begin by determining the amount of CPU, memory, and disk resources the database uses in the following scenarios:
When your system is idle, or when little database and non-database activity exists
At average workloads
At peak workloads
Workload is an important factor when evaluating the level of resource utilization for your system. During peak workload hours, 90 percent utilization of a resource, such as a CPU with 10 percent idle and waiting time, can be acceptable. However, if your system shows high utilization at normal workload, then there is no room for additional workload. After these values are determined, you can set the appropriate threshold values for the related metrics so the system can automatically generate alerts when these thresholds are exceeded. For information about setting metric thresholds, see "Setting Metric Thresholds for Performance Alerts".
This section contains the following topics:
This section describes how to monitor CPU utilization.
On the Performance Summary page, from the View list, select CPU Details.
The CPU Details view appears. This view contains CPU utilization statistics gathered over the last hour, the CPU load, and the top 10 processes ordered by CPU utilization.
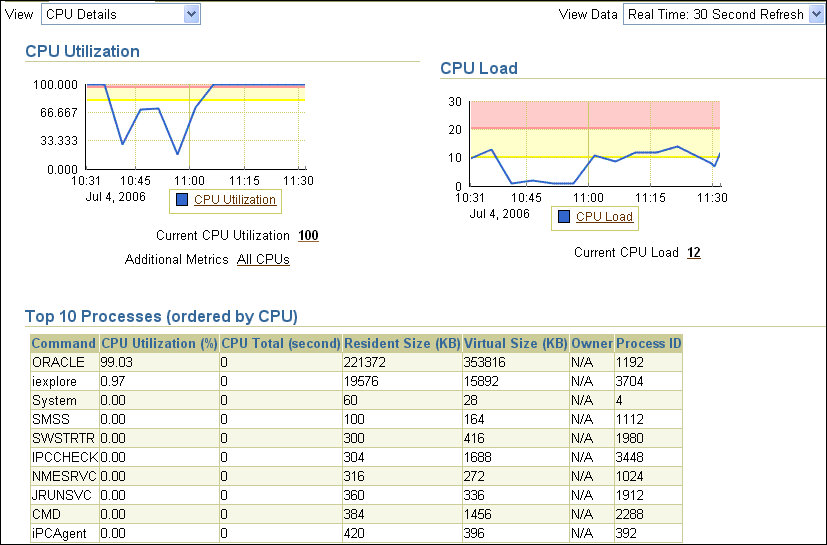
Verify the current CPU utilization using the CPU Utilization graph.
The CPU Utilization graph shows how much CPU is currently used. During normal workload hours, the value should not exceed the critical threshold (shown in red).
Verify the CPU statistics over the last 24 hours.
Click CPU Utilization.
The CPU Utilization page appears. This page contains CPU utilization statistics and related alerts generated over the last 24 hours.
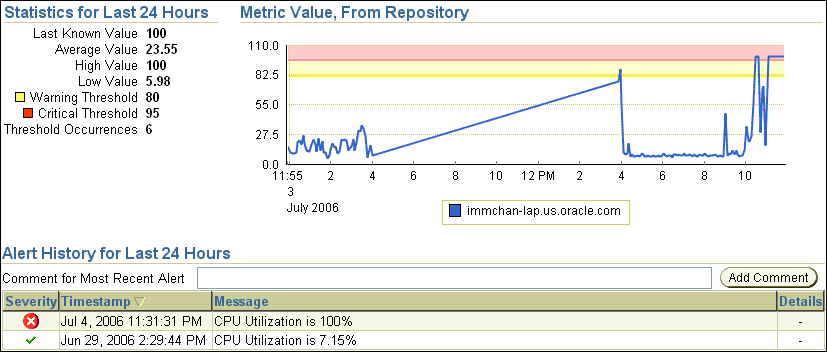
In this example, the CPU utilization crossed the critical threshold value at 11:31 p.m., so an alert for CPU utilization is generated to indicate that a CPU performance problem may exist. If you notice an unexpected spike in this value that is sustained through normal workload hours, then the CPU performance problem should be investigated.
Verify the current CPU load using the CPU Load graph.
The CPU Load graph shows the current CPU load. During normal workload hours, the value should not exceed the warning threshold (shown in yellow).
CPU load represents the average number of processes waiting to be scheduled for CPU resources in the previous minute, or the level of CPU contention time over time.
Verify the CPU load over the last 24 hours.
Click CPU Load.
The CPU Queue Length page appears. This page contains CPU load statistics and related alerts generated over the last 24 hours.
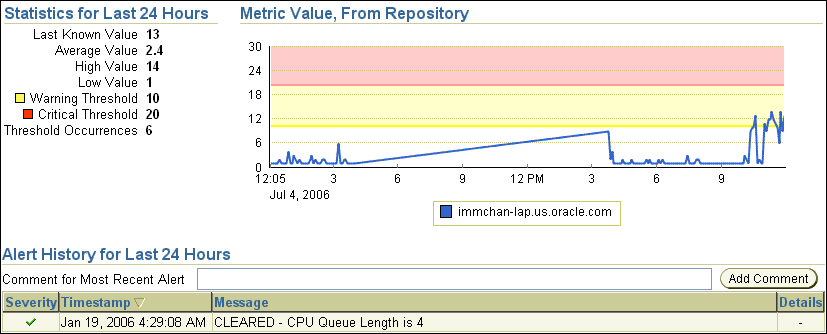
In this example, the CPU load crossed the warning threshold after 10:00 p.m., but it is still below the critical threshold, so an alert was not generated. If you notice an unexpected spike in this value that is sustained through normal workload hours, then a CPU performance problem might exist.
On the Performance Summary page, verify the top processes in the Top 10 Processes section.
If a process is taking up too much of the CPU utilization percentage, then this process should be investigated.
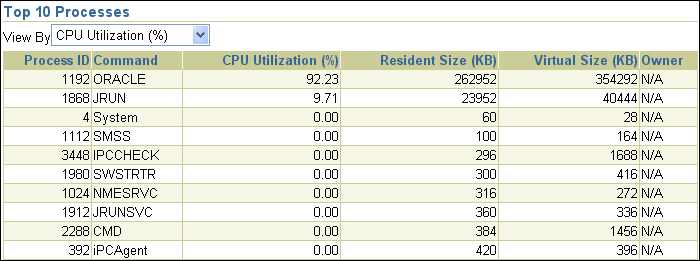
In this example, the database is consuming 92 percent of CPU utilization. Therefore, the database is the likely source of the CPU performance problem and should be investigated.
If a CPU performance problem is identified, you can try to resolve the issue by:
Using Oracle Database Resource Manager to reduce the impact of peak-load-use patterns by prioritizing CPU resource allocation
Avoiding running too many processes that use a lot of CPU
Increasing hardware capacity, including changing the system architecture
See Also:
Oracle Database Performance Tuning Guide for information about resolving CPU issues
Oracle Database Administrator's Guide for information about Oracle Database Resource Manager
This section describes how to monitor memory utilization.
To monitor memory utilization:
On the Performance Summary page, from the View list, select Memory Details.
The Memory Details view appears. This view contains memory and swap utilization statistics gathered over the last hour, and the top 10 processes ordered by memory utilization.
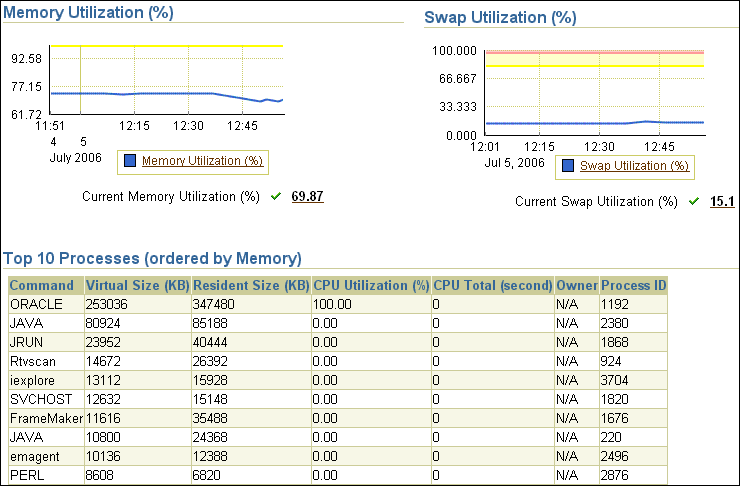
Verify the current memory utilization using the Memory Utilization graph.
The Memory Utilization graph shows how much memory is currently being used. During normal workload hours, the value should not exceed the warning threshold (shown in yellow).
Verify the memory statistics over the last 24 hours.
Click Memory Utilization.
The Memory Utilization page appears. This page contains memory utilization statistics and related alerts generated over the last 24 hours.
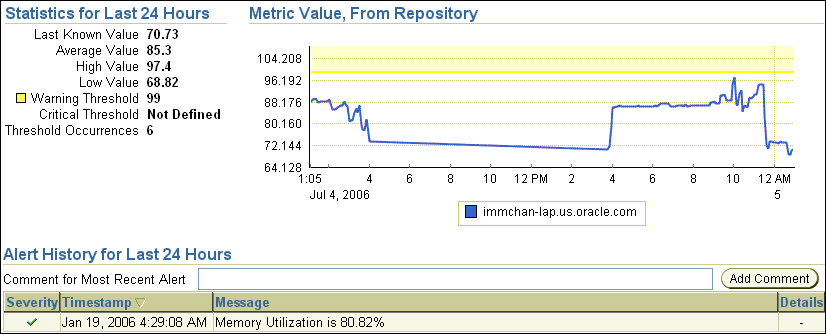
In this example, memory utilization is near, but does not exceed, the warning threshold value (99 percent) from 4:00 p.m. to 11:00 p.m., so an alert is not generated. If you notice an unexpected spike in this value that is sustained through normal workload hours, then a memory performance problem might exist.
Verify current swap utilization using the Swap Utilization graph.
The Swap Utilization graph shows how much swapping space is currently being used. During normal workload hours, the value should not exceed the warning threshold (shown in yellow).
Verify swap utilization over the last 24 hours.
Click Swap Utilization.
The Swap Utilization page appears. This page contains swap utilization statistics and related alerts generated over the last 24 hours.
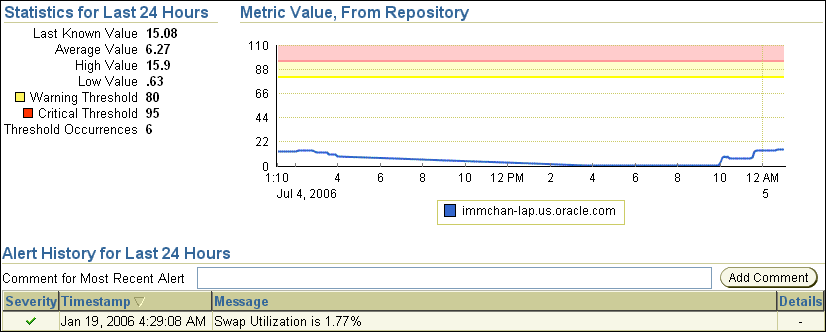
In this example, swap utilization is below the warning threshold, so an alert is not generated. If you notice an unexpected spike in this value that is sustained through normal workload hours, then a memory performance problem might exist.
On the Performance Summary page, verify the top processes in the Top 10 Processes section.
If a process is taking up too much memory, then this process should be investigated.
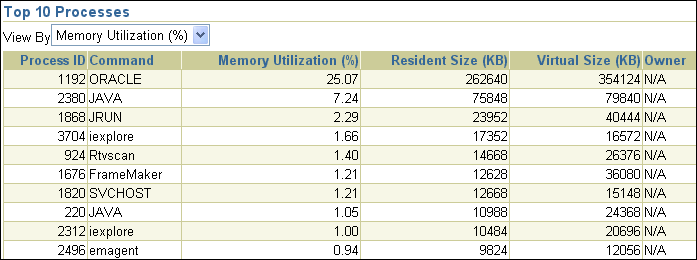
In this example, the database is consuming 25 percent of memory utilization, and there does not appear to be a memory performance problem.
If a memory performance problem is identified, you can attempt to resolve the issue by:
Using Automatic Shared Memory Management to manage the SGA memory
Using Automatic PGA Management to manage SQL memory execution
Avoiding running too many processes that use a lot of memory
Reducing paging or swapping
Reducing the number of open cursors and hard parsing with cursor sharing
See Also:
Oracle Database Performance Tuning Guide for information about resolving memory issues
This section describes how to monitor disk I/O utilization.
To monitor disk I/O utilization:
On the Performance Summary page, from the View list, select Disk Details.
The Disk Details view appears. This view contains disk I/O utilization and service time statistics gathered over the last hour, and the top disk devices ordered by busy percentage.
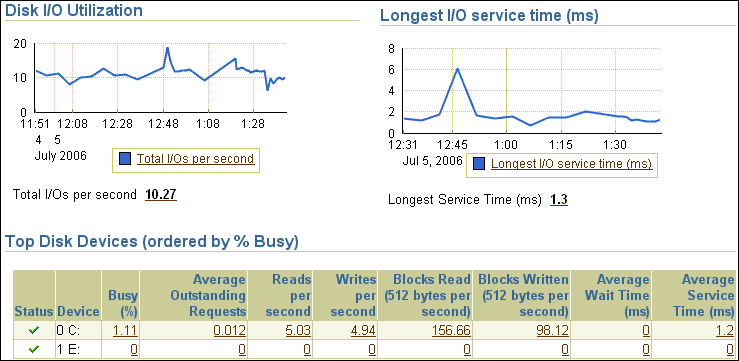
Verify the current disk I/O utilization using the Disk I/O Utilization graph.
The Disk I/O Utilization graph shows how many disk I/Os are being performed per second.
Verify the disk I/O statistics over the last 24 hours.
Click Total I/Os per Second.
The Total I/O page appears. This page contains disk utilization statistics and related alerts generated over the last 24 hours.
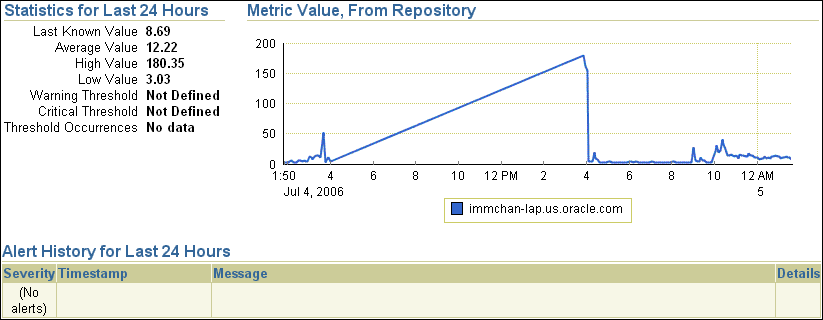
In this example, an alert is not generated because a threshold is not defined. If you notice an unexpected spike in this value that is sustained through normal workload hours, as is the case in this example from 2:00 p.m. to 4:00 p.m., then a disk I/O performance problem might exist and should be investigated.
Verify the current I/O service time using the Longest I/O Service Time graph.
The Longest I/O Service Time graph shows the longest service time for disk I/Os.
Verify I/O service time over the last 24 hours.
Click Longest I/O Service Time.
The Longest Service Time page appears. This page contains I/O service time statistics and related alerts generated over the last 24 hours.
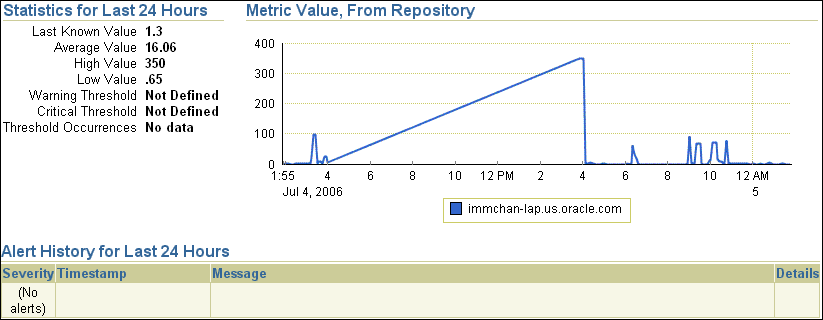
In this example, an alert is not generated because a threshold is not defined. If you notice an unexpected spike in this value that is sustained through normal workload hours, as is the case in this example from 2:00 p.m. to 4:00 p.m., then a disk I/O performance problem might exist and should be investigated.
On the Disk Details page, verify the disk devices in the Top Disk Devices section.
If a particular disk is busy a high percentage of the time, then this disk should be investigated.

In this example, the drive that hosts Oracle Database (drive C) is only busy about 1.3 percent of the time, and there does not appear to be a disk performance problem.
If a disk I/O performance problem is identified, you can attempt to resolve the problem by:
Using Automatic Storage Management (ASM) to manage database storage
Striping everything across every disk to distribute I/O
Moving files, such as archive logs and redo logs, to separate disks
Storing required data in memory to reduce the number of physical I/Os
See Also:
Oracle Database Performance Tuning Guide for information about resolving disk I/O issues